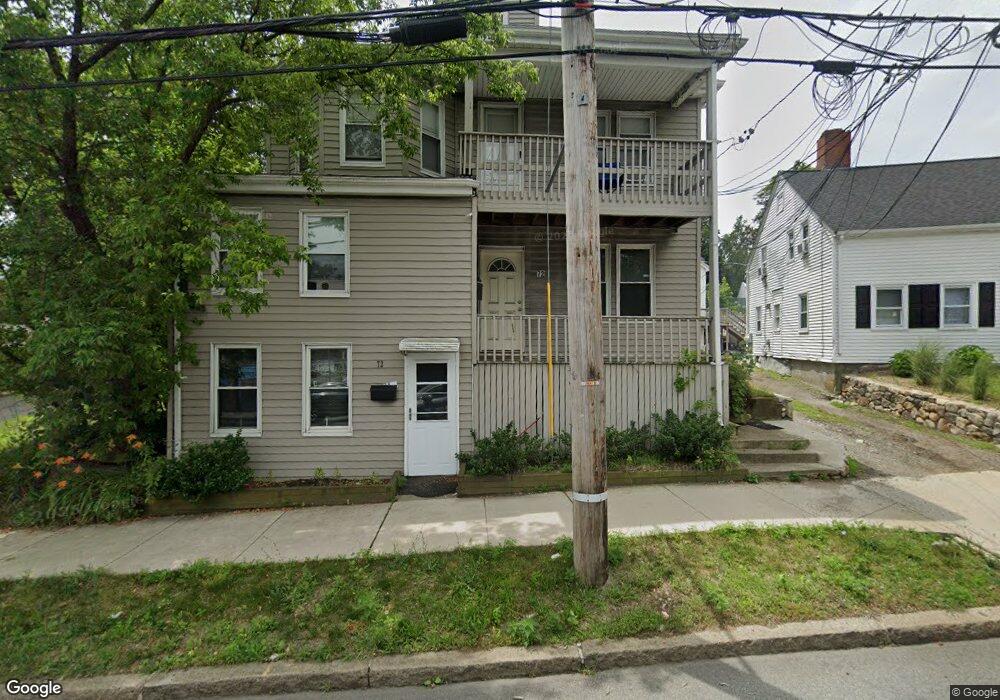
72 Lowell St Peabody, MA 01960
Peabody Town Center NeighborhoodEstimated Value: $659,000 - $804,000
4
Beds
3
Baths
2,620
Sq Ft
$274/Sq Ft
Est. Value
About This Home
This home is located at 72 Lowell St, Peabody, MA 01960 and is currently estimated at $717,333, approximately $273 per square foot. 72 Lowell St is a home located in Essex County with nearby schools including Peabody Veterans Memorial High School, St John The Baptist School, and The Phoenix School.
Ownership History
Date
Name
Owned For
Owner Type
Purchase Details
Closed on
Jun 24, 2011
Sold by
Vontzalides Athan A
Bought by
72 Lowell St Ret
Current Estimated Value
Purchase Details
Closed on
Dec 1, 1984
Bought by
72 Lowell St Rt
Create a Home Valuation Report for This Property
The Home Valuation Report is an in-depth analysis detailing your home's value as well as a comparison with similar homes in the area
Home Values in the Area
Average Home Value in this Area
Purchase History
| Date | Buyer | Sale Price | Title Company |
|---|---|---|---|
| 72 Lowell St Ret | -- | -- | |
| 72 Lowell St Rt | $96,000 | -- |
Source: Public Records
Mortgage History
| Date | Status | Borrower | Loan Amount |
|---|---|---|---|
| Previous Owner | 72 Lowell St Rt | $144,157 | |
| Previous Owner | 72 Lowell St Rt | $83,500 | |
| Previous Owner | 72 Lowell St Rt | $93,000 | |
| Previous Owner | 72 Lowell St Rt | $95,000 |
Source: Public Records
Tax History Compared to Growth
Tax History
| Year | Tax Paid | Tax Assessment Tax Assessment Total Assessment is a certain percentage of the fair market value that is determined by local assessors to be the total taxable value of land and additions on the property. | Land | Improvement |
|---|---|---|---|---|
| 2025 | $5,031 | $543,300 | $220,500 | $322,800 |
| 2024 | $4,575 | $501,600 | $220,500 | $281,100 |
| 2023 | $4,896 | $514,300 | $196,900 | $317,400 |
| 2022 | $4,757 | $471,000 | $175,900 | $295,100 |
| 2021 | $4,556 | $434,300 | $159,900 | $274,400 |
| 2020 | $4,469 | $416,100 | $159,900 | $256,200 |
| 2019 | $4,350 | $395,100 | $159,900 | $235,200 |
| 2018 | $3,820 | $333,300 | $145,300 | $188,000 |
| 2017 | $3,456 | $293,900 | $145,300 | $148,600 |
| 2016 | $3,321 | $278,600 | $145,300 | $133,300 |
| 2015 | $3,455 | $280,900 | $141,700 | $139,200 |
Source: Public Records
Map
Nearby Homes
- 48 Franklin St
- 8 Crowninshield St Unit 111
- 8 Walnut St Unit 209
- 130 Lowell St
- 4 Elm St Unit 3
- 111 Foster St Unit 401
- 111 Foster St Unit 416
- 8R Elm St Unit 2
- 10 Elliott Place Unit 1R
- 26 Elm St
- 46 Walnut St
- 158 Lowell St Unit 4
- 45 Ellsworth Rd
- 4 Northend St
- 11 A Endicott St Unit 3
- 9 Sutton St
- 13 State St
- 25 Northend St
- 2 Osborne St
- 12 Sutton St