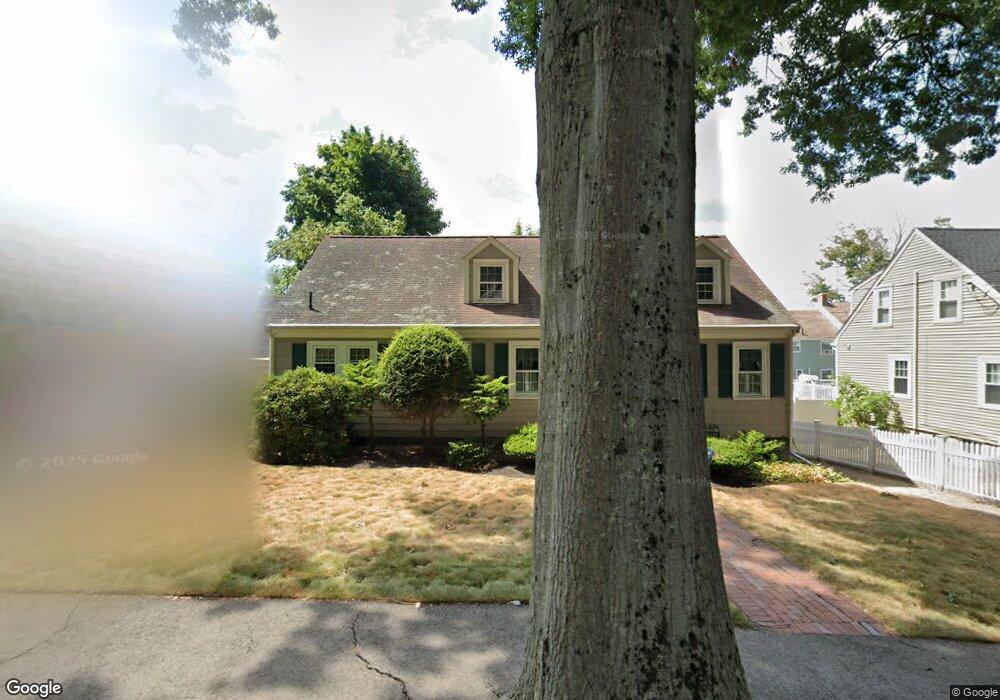
72 Myopia Rd Quincy, MA 02169
West Quincy NeighborhoodEstimated Value: $697,000 - $808,182
3
Beds
2
Baths
1,544
Sq Ft
$486/Sq Ft
Est. Value
About This Home
This home is located at 72 Myopia Rd, Quincy, MA 02169 and is currently estimated at $750,046, approximately $485 per square foot. 72 Myopia Rd is a home located in Norfolk County with nearby schools including Charles A. Bernazzani Elementary School, Central Middle School, and North Quincy High School.
Ownership History
Date
Name
Owned For
Owner Type
Purchase Details
Closed on
Aug 15, 2025
Sold by
Farmer Ft and Possehl
Bought by
Adduci Ryan P
Current Estimated Value
Home Financials for this Owner
Home Financials are based on the most recent Mortgage that was taken out on this home.
Original Mortgage
$570,000
Outstanding Balance
$566,927
Interest Rate
5.63%
Mortgage Type
Purchase Money Mortgage
Estimated Equity
$183,119
Purchase Details
Closed on
Nov 28, 2018
Sold by
Farmer Judith E
Bought by
Farmer Ft and Farmer-Possehl
Create a Home Valuation Report for This Property
The Home Valuation Report is an in-depth analysis detailing your home's value as well as a comparison with similar homes in the area
Home Values in the Area
Average Home Value in this Area
Purchase History
| Date | Buyer | Sale Price | Title Company |
|---|---|---|---|
| Adduci Ryan P | $712,500 | -- | |
| Farmer Ft | -- | -- |
Source: Public Records
Mortgage History
| Date | Status | Borrower | Loan Amount |
|---|---|---|---|
| Open | Adduci Ryan P | $570,000 |
Source: Public Records
Tax History
| Year | Tax Paid | Tax Assessment Tax Assessment Total Assessment is a certain percentage of the fair market value that is determined by local assessors to be the total taxable value of land and additions on the property. | Land | Improvement |
|---|---|---|---|---|
| 2025 | $8,621 | $747,700 | $423,700 | $324,000 |
| 2024 | $8,395 | $744,900 | $423,700 | $321,200 |
| 2023 | $7,831 | $703,600 | $403,500 | $300,100 |
| 2022 | $7,045 | $588,100 | $295,900 | $292,200 |
| 2021 | $7,007 | $577,200 | $295,900 | $281,300 |
| 2020 | $7,122 | $573,000 | $295,900 | $277,100 |
| 2019 | $6,534 | $520,600 | $276,500 | $244,100 |
| 2018 | $6,330 | $474,500 | $240,000 | $234,500 |
| 2017 | $6,372 | $449,700 | $251,400 | $198,300 |
| 2016 | $5,869 | $408,700 | $224,400 | $184,300 |
| 2015 | $5,449 | $373,200 | $204,000 | $169,200 |
| 2014 | $5,107 | $343,700 | $197,900 | $145,800 |
Source: Public Records
Map
Nearby Homes
- 41 Wallace Rd
- 114 Willard St Unit 4
- 230 Willard St Unit 102
- 281 Elmwood Ave
- 440 Granite Ave Unit 201
- 84 Gardiner Rd
- 40 Cross St Unit 1
- 0 Franklin St
- 1 Cityview Ln Unit 506
- 1 Cityview Ln Unit 709
- 1 Cityview Ln Unit 707
- 154 N Central Ave
- 211 Copeland St
- 72 Oakland Ave
- 267-269 Farrington St
- 46 Suomi Rd Unit 46
- 46 Suomi Rd
- 12 Nelson St
- 459 Willard St Unit 303
- 52 Hamilton Ave
Your Personal Tour Guide
Ask me questions while you tour the home.