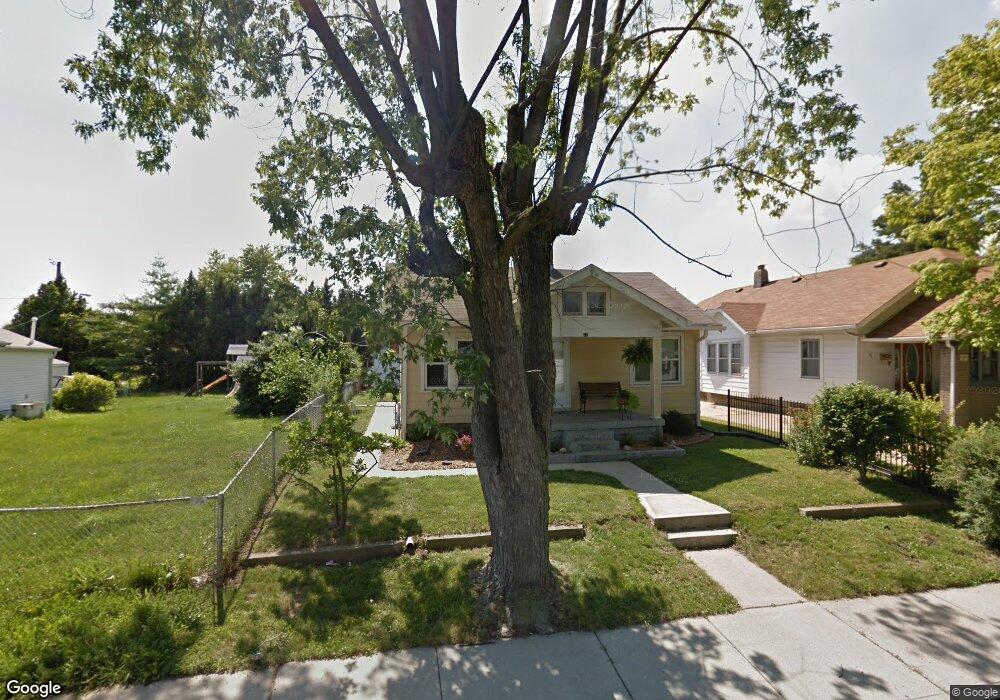
72 N 3rd Ave Beech Grove, IN 46107
Estimated Value: $152,000 - $189,000
2
Beds
1
Bath
780
Sq Ft
$214/Sq Ft
Est. Value
About This Home
This home is located at 72 N 3rd Ave, Beech Grove, IN 46107 and is currently estimated at $167,282, approximately $214 per square foot. 72 N 3rd Ave is a home located in Marion County with nearby schools including Hornet Park Elementary School, Central Elementary School, and South Grove Intermediate School.
Ownership History
Date
Name
Owned For
Owner Type
Purchase Details
Closed on
Sep 19, 2022
Sold by
Kay Alford Sondra
Bought by
Alford Deborah Ann
Current Estimated Value
Purchase Details
Closed on
Apr 18, 2011
Sold by
Alford Ronald Wayne and Alford Sondra Kay
Bought by
Alford Ronald Wayne and Alford Sondra Kay
Purchase Details
Closed on
Aug 30, 2010
Sold by
Alford Ronald Wayne
Bought by
Alford Ronald Wayne and Alford Sondra Kay
Purchase Details
Closed on
Aug 25, 2010
Sold by
Secretary Of Housing & Urban Development
Bought by
Alford Ronald Wayne
Purchase Details
Closed on
May 11, 2010
Sold by
U S Bank National Association
Bought by
The Secretary Of Housing & Urban Develop
Purchase Details
Closed on
May 3, 2010
Sold by
Cano Jorge L
Bought by
U S Bank National Association
Create a Home Valuation Report for This Property
The Home Valuation Report is an in-depth analysis detailing your home's value as well as a comparison with similar homes in the area
Home Values in the Area
Average Home Value in this Area
Purchase History
| Date | Buyer | Sale Price | Title Company |
|---|---|---|---|
| Alford Deborah Ann | -- | -- | |
| Alford Ronald Wayne | -- | None Available | |
| Alford Ronald Wayne | -- | None Available | |
| Alford Ronald Wayne | -- | None Available | |
| The Secretary Of Housing & Urban Develop | -- | None Available | |
| U S Bank National Association | $74,896 | None Available |
Source: Public Records
Tax History Compared to Growth
Tax History
| Year | Tax Paid | Tax Assessment Tax Assessment Total Assessment is a certain percentage of the fair market value that is determined by local assessors to be the total taxable value of land and additions on the property. | Land | Improvement |
|---|---|---|---|---|
| 2024 | $1,289 | $102,900 | $17,000 | $85,900 |
| 2023 | $1,289 | $102,900 | $17,000 | $85,900 |
| 2022 | $1,192 | $92,600 | $17,000 | $75,600 |
| 2021 | $2,182 | $78,800 | $17,000 | $61,800 |
| 2020 | $1,955 | $75,100 | $17,000 | $58,100 |
| 2019 | $1,572 | $62,700 | $7,000 | $55,700 |
| 2018 | $1,373 | $56,700 | $7,000 | $49,700 |
| 2017 | $1,434 | $57,300 | $7,000 | $50,300 |
| 2016 | $1,191 | $48,100 | $7,000 | $41,100 |
| 2014 | $1,149 | $48,900 | $7,000 | $41,900 |
| 2013 | $1,238 | $48,900 | $7,000 | $41,900 |
Source: Public Records
Map
Nearby Homes