72 Nash St Chicopee, MA 01013
Willimansett NeighborhoodEstimated Value: $285,744 - $367,000
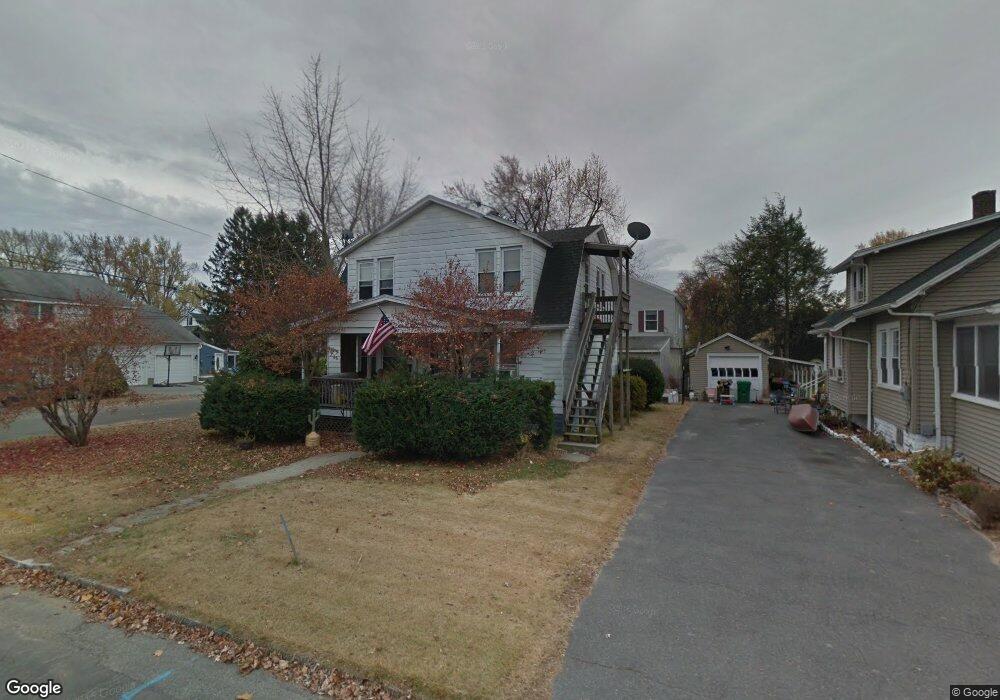
About This Home
This home is located at 72 Nash St, Chicopee, MA 01013 and is currently estimated at $315,186, approximately $217 per square foot. 72 Nash St is a home located in Hampden County with nearby schools including Fairview Elementary School, Bellamy Middle School, and Chicopee Comprehensive High School.
Ownership History
We collect this data history from publicly available records. To have your information removed, we recommend requesting removal directly through your county’s website.
Purchase Details
Home Financials for this Owner
Home Financials are based on the most recent Mortgage that was taken out on this home.Home Values in the Area
Average Home Value in this Area
Purchase History
We collect this data history from publicly available records. To have your information removed, we recommend requesting removal directly through your county’s website.
| Date | Buyer | Sale Price | Title Company |
|---|---|---|---|
| $86,000 | -- |
Mortgage History
We collect this data history from publicly available records. To have your information removed, we recommend requesting removal directly through your county’s website.
| Date | Status | Borrower | Loan Amount |
|---|---|---|---|
| Open | $60,000 | ||
| Closed | $20,000 |
Tax History
We collect this data history from publicly available records. To have your information removed, we recommend requesting removal directly through your county’s website.
| Year | Tax Paid | Tax Assessment Tax Assessment Total Assessment is a certain percentage of the fair market value that is determined by local assessors to be the total taxable value of land and additions on the property. | Land | Improvement |
|---|---|---|---|---|
| 2025 | $3,409 | $224,900 | $69,200 | $155,700 |
| 2024 | $3,231 | $218,900 | $67,800 | $151,100 |
| 2023 | $3,015 | $199,000 | $61,600 | $137,400 |
| 2022 | $2,897 | $170,500 | $53,600 | $116,900 |
| 2021 | $2,735 | $155,300 | $48,700 | $106,600 |
| 2020 | $2,593 | $148,500 | $48,700 | $99,800 |
| 2019 | $2,464 | $137,200 | $48,700 | $88,500 |
| 2018 | $2,391 | $130,600 | $46,400 | $84,200 |
| 2017 | $2,152 | $124,300 | $46,400 | $77,900 |
| 2016 | $2,183 | $129,100 | $46,400 | $82,700 |
| 2015 | $2,077 | $118,400 | $46,400 | $72,000 |
| 2014 | $1,038 | $118,400 | $46,400 | $72,000 |
Map
- 43 Ferry St
- 42 Ferry St
- 92 Walter St
- 621 Chicopee St
- 38 Whitman St
- 28 State St
- 38 Bonner St
- 26 Vernon St
- 958 Main St
- 20 Mount Carmel Ave
- 5 Vernon St
- 94 Cora Ave
- 103 Brown Ave
- 2143-2145 Northampton St
- 40 Laurel St
- 51 View St
- 220 South St
- 24-26 Gilman St
- 90 Mckinstry Ave Unit 117
- 90 Mckinstry Ave Unit 106
Ask me questions while you tour the home.