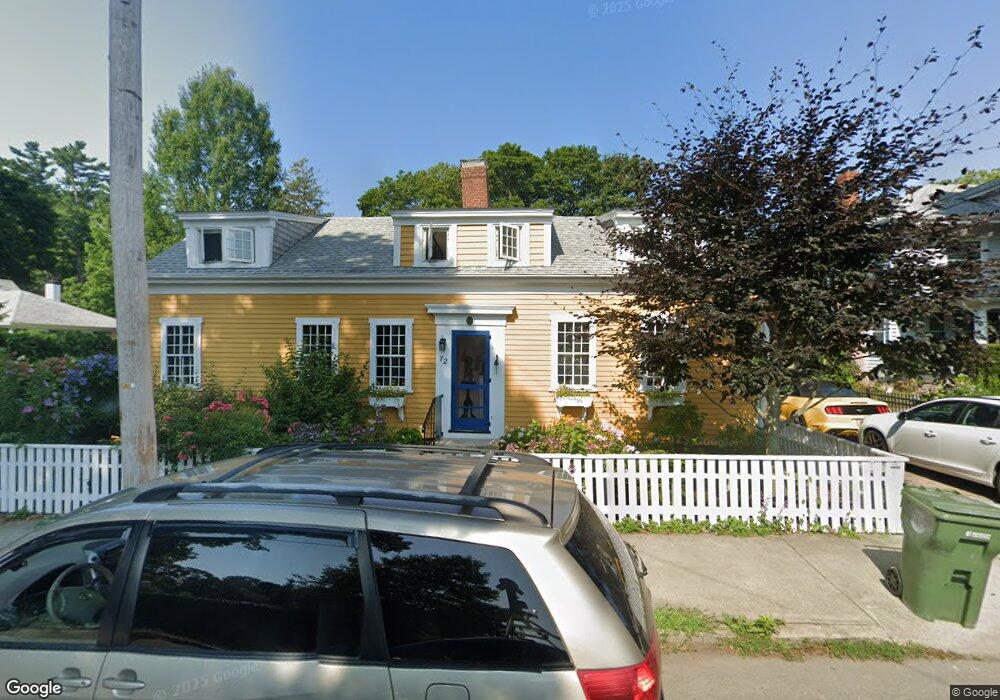
72 Pleasant St Unit 1 Marion, MA 02738
Marion Center NeighborhoodEstimated Value: $940,000 - $1,494,000
4
Beds
3
Baths
3,369
Sq Ft
$367/Sq Ft
Est. Value
About This Home
This home is located at 72 Pleasant St Unit 1, Marion, MA 02738 and is currently estimated at $1,238,078, approximately $367 per square foot. 72 Pleasant St Unit 1 is a home located in Plymouth County with nearby schools including Old Rochester Regional High School.
Ownership History
Date
Name
Owned For
Owner Type
Purchase Details
Closed on
Jun 20, 2023
Sold by
Bonnie Jeanne Tavares Ret and Tavares
Bought by
Reinhardt Scott and Reinhardt Geri
Current Estimated Value
Purchase Details
Closed on
Dec 29, 2022
Sold by
Ischia Marion Rt and Tavares
Bought by
Bonnie J Tavares Ret and Tavares
Purchase Details
Closed on
May 10, 2022
Sold by
Tavares Paul J and Tavares Bonnie J
Bought by
Ischia Marion Rt and Travares
Purchase Details
Closed on
Jul 29, 2004
Sold by
Hunsdorfer Peter A and Hunsdorfer Sally L
Bought by
Hunsdorfer Peter A
Home Financials for this Owner
Home Financials are based on the most recent Mortgage that was taken out on this home.
Original Mortgage
$179,000
Interest Rate
6.33%
Mortgage Type
Purchase Money Mortgage
Create a Home Valuation Report for This Property
The Home Valuation Report is an in-depth analysis detailing your home's value as well as a comparison with similar homes in the area
Home Values in the Area
Average Home Value in this Area
Purchase History
| Date | Buyer | Sale Price | Title Company |
|---|---|---|---|
| Reinhardt Scott | $1,100,000 | None Available | |
| Bonnie J Tavares Ret | -- | None Available | |
| Ischia Marion Rt | -- | None Available | |
| Hunsdorfer Peter A | -- | -- |
Source: Public Records
Mortgage History
| Date | Status | Borrower | Loan Amount |
|---|---|---|---|
| Previous Owner | Hunsdorfer Peter A | $185,000 | |
| Previous Owner | Hunsdorfer Peter A | $179,000 |
Source: Public Records
Tax History Compared to Growth
Tax History
| Year | Tax Paid | Tax Assessment Tax Assessment Total Assessment is a certain percentage of the fair market value that is determined by local assessors to be the total taxable value of land and additions on the property. | Land | Improvement |
|---|---|---|---|---|
| 2025 | $8,955 | $960,800 | $489,400 | $471,400 |
| 2024 | $8,166 | $881,900 | $446,900 | $435,000 |
| 2023 | $7,679 | $813,500 | $414,900 | $398,600 |
| 2022 | $9,659 | $890,200 | $401,100 | $489,100 |
| 2021 | $8,739 | $772,000 | $355,600 | $416,400 |
| 2020 | $4,675 | $642,100 | $283,900 | $358,200 |
| 2019 | $4,535 | $616,700 | $258,500 | $358,200 |
| 2018 | $7,362 | $643,000 | $286,100 | $356,900 |
| 2017 | $6,981 | $611,800 | $286,100 | $325,700 |
| 2016 | $6,425 | $568,100 | $286,100 | $282,000 |
| 2015 | $6,359 | $572,400 | $277,900 | $294,500 |
Source: Public Records
Map
Nearby Homes