72 Summer St Kennebunk, ME 04043
Estimated Value: $772,000 - $885,000
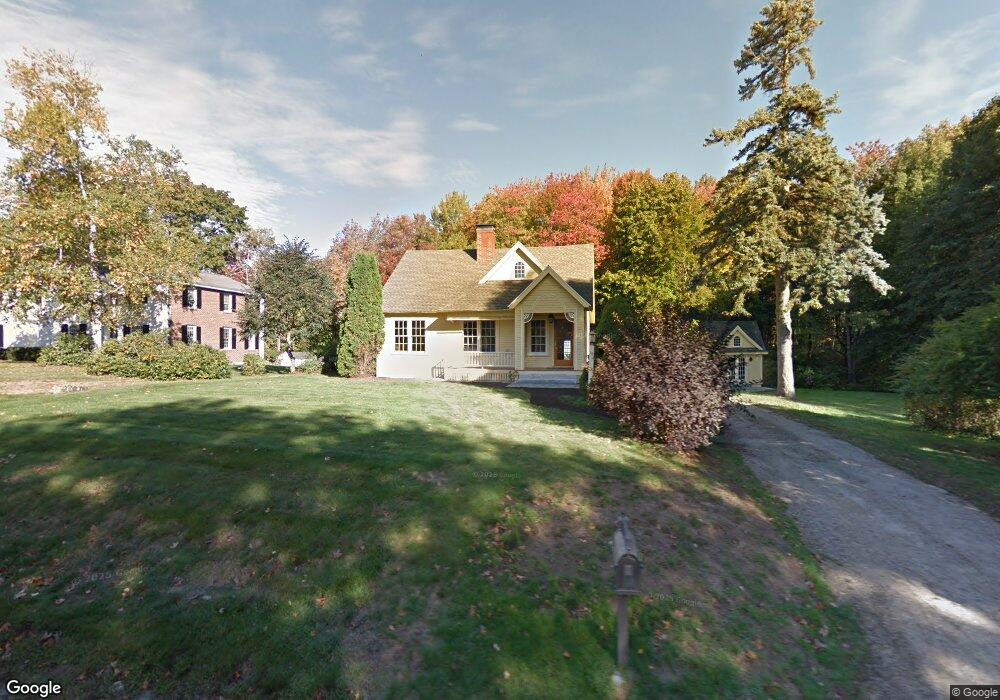
About This Home
This home is located at 72 Summer St, Kennebunk, ME 04043 and is currently estimated at $825,421, approximately $423 per square foot. 72 Summer St is a home located in York County with nearby schools including Kennebunk High School, School Around Us, and The New School.
Ownership History
We collect this data history from publicly available records. To have your information removed, we recommend requesting removal directly through your county’s website.
Purchase Details
Purchase Details
Purchase Details
Purchase Details
Home Values in the Area
Average Home Value in this Area
Purchase History
We collect this data history from publicly available records. To have your information removed, we recommend requesting removal directly through your county’s website.
| Date | Buyer | Sale Price | Title Company |
|---|---|---|---|
| -- | None Available | ||
| -- | -- | ||
| -- | -- | ||
| -- | -- |
Tax History
We collect this data history from publicly available records. To have your information removed, we recommend requesting removal directly through your county’s website.
| Year | Tax Paid | Tax Assessment Tax Assessment Total Assessment is a certain percentage of the fair market value that is determined by local assessors to be the total taxable value of land and additions on the property. | Land | Improvement |
|---|---|---|---|---|
| 2025 | $8,110 | $823,400 | $394,300 | $429,100 |
| 2024 | $7,609 | $448,900 | $151,500 | $297,400 |
| 2023 | $7,205 | $448,900 | $151,500 | $297,400 |
| 2022 | $6,554 | $448,900 | $151,500 | $297,400 |
| 2021 | $6,041 | $448,900 | $151,500 | $297,400 |
| 2020 | $5,998 | $448,900 | $151,500 | $297,400 |
| 2019 | $6,172 | $448,900 | $151,500 | $297,400 |
| 2018 | $5,891 | $336,600 | $113,600 | $223,000 |
| 2017 | $5,571 | $336,600 | $113,600 | $223,000 |
| 2016 | $5,352 | $336,600 | $113,600 | $223,000 |
| 2015 | $3,608 | $235,800 | $87,800 | $148,000 |
| 2014 | $3,513 | $235,800 | $87,800 | $148,000 |
Map
- 17 Sea Rd
- 40 Summer St
- 32 Summer St
- 2 Mothers Way
- 28 Woodside Dr
- 9 Summer St
- 24 Grove St Unit 24
- 4 Hearthstone Dr
- 5 Heath Rd
- 7 Water St
- 60 Brown St Unit 7
- Lot 14A River Rd
- 7 Storer St
- 42 Farragut Way Unit 42
- 1 Boundary Way
- 106 Farragut Way Unit 259
- 106 Farragut Way Unit 151
- 106 Farragut Way Unit 149
- 106 Farragut Way Unit 366
- 12 Powder Mill Dr
Ask me questions while you tour the home.