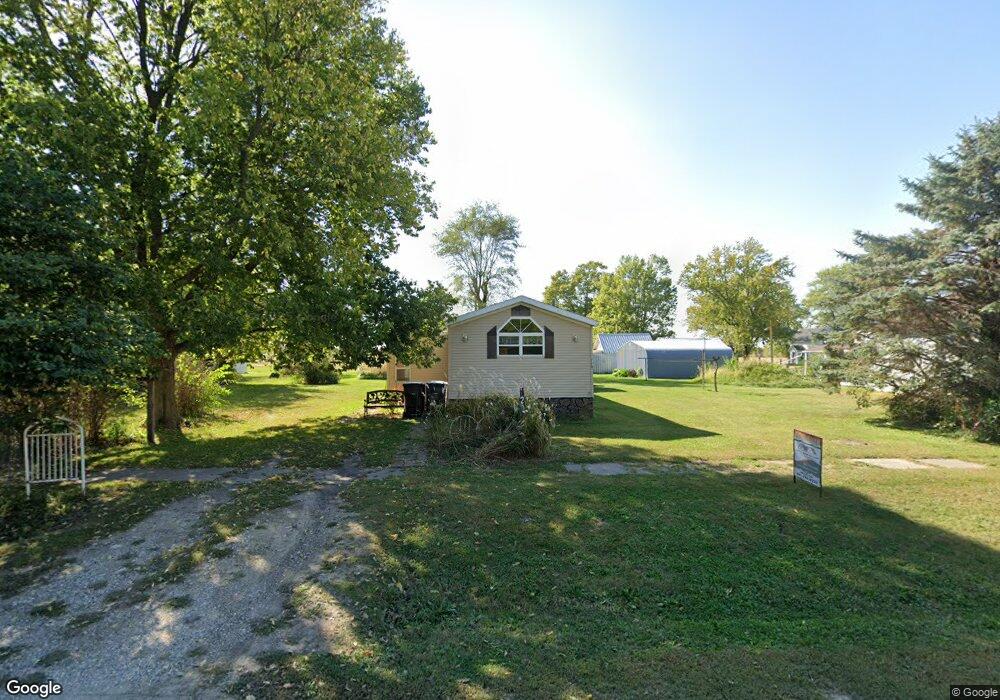
720 2nd St Lorimor, IA 50149
Estimated Value: $90,340 - $126,000
3
Beds
2
Baths
1,140
Sq Ft
$95/Sq Ft
Est. Value
About This Home
This home is located at 720 2nd St, Lorimor, IA 50149 and is currently estimated at $107,835, approximately $94 per square foot. 720 2nd St is a home located in Union County with nearby schools including East Union Middle/High School.
Ownership History
Date
Name
Owned For
Owner Type
Purchase Details
Closed on
Jan 31, 2024
Sold by
Decker Carolyn A
Bought by
Decker Kevin L and Tucker Karen A
Current Estimated Value
Create a Home Valuation Report for This Property
The Home Valuation Report is an in-depth analysis detailing your home's value as well as a comparison with similar homes in the area
Purchase History
| Date | Buyer | Sale Price | Title Company |
|---|---|---|---|
| Decker Kevin L | -- | None Listed On Document | |
| Decker Kevin L | -- | None Listed On Document |
Source: Public Records
Tax History
| Year | Tax Paid | Tax Assessment Tax Assessment Total Assessment is a certain percentage of the fair market value that is determined by local assessors to be the total taxable value of land and additions on the property. | Land | Improvement |
|---|---|---|---|---|
| 2025 | $1,616 | $75,740 | $12,160 | $63,580 |
| 2024 | $1,400 | $78,450 | $12,160 | $66,290 |
| 2023 | $1,192 | $64,780 | $8,130 | $56,650 |
| 2022 | $1,222 | $55,530 | $8,130 | $47,400 |
| 2021 | $1,222 | $51,900 | $7,600 | $44,300 |
| 2020 | $738 | $37,250 | $3,180 | $34,070 |
| 2019 | $762 | $37,250 | $0 | $0 |
| 2018 | $992 | $46,920 | $0 | $0 |
| 2017 | $992 | $46,920 | $0 | $0 |
| 2016 | $902 | $46,920 | $0 | $0 |
| 2015 | $902 | $43,050 | $0 | $0 |
| 2014 | $834 | $43,050 | $0 | $0 |
Source: Public Records
Map
Nearby Homes
Your Personal Tour Guide
Ask me questions while you tour the home.