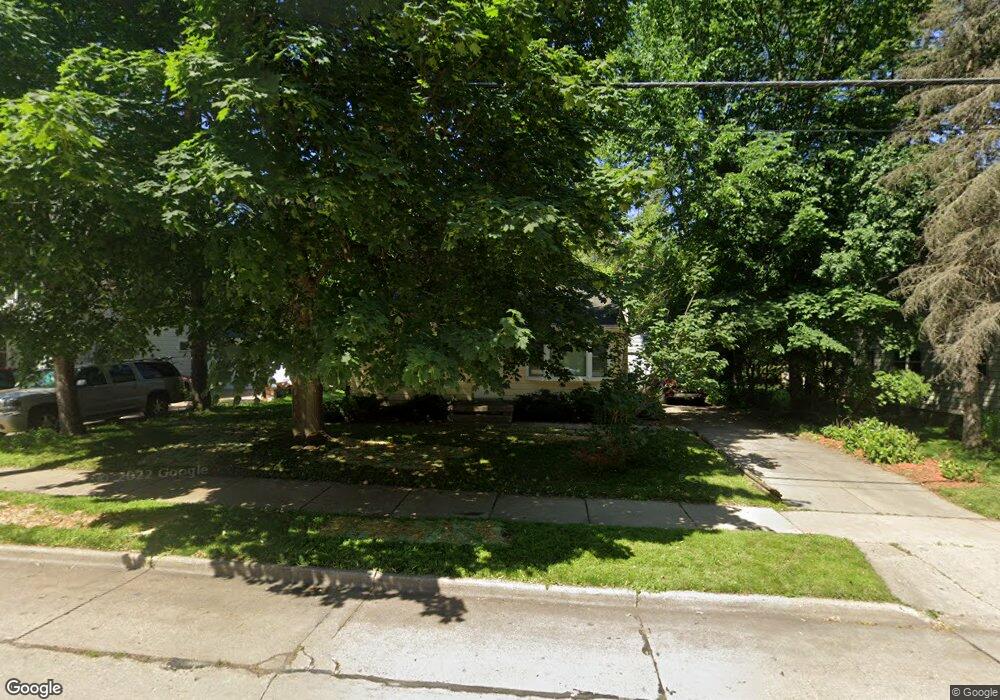
720 Delafield St Waukesha, WI 53188
Estimated Value: $246,471 - $299,000
2
Beds
1
Bath
720
Sq Ft
$372/Sq Ft
Est. Value
About This Home
This home is located at 720 Delafield St, Waukesha, WI 53188 and is currently estimated at $267,618, approximately $371 per square foot. 720 Delafield St is a home located in Waukesha County with nearby schools including Hawthorne Elementary School, Butler Middle School, and North High School.
Ownership History
Date
Name
Owned For
Owner Type
Purchase Details
Closed on
May 23, 2001
Sold by
Meiter Edward G
Bought by
Seeling Gary
Current Estimated Value
Home Financials for this Owner
Home Financials are based on the most recent Mortgage that was taken out on this home.
Original Mortgage
$60,000
Outstanding Balance
$22,653
Interest Rate
7.18%
Estimated Equity
$244,965
Purchase Details
Closed on
Jul 30, 1999
Sold by
Lobner Daniel E
Bought by
Meiter Edward G
Home Financials for this Owner
Home Financials are based on the most recent Mortgage that was taken out on this home.
Original Mortgage
$72,800
Interest Rate
10.55%
Purchase Details
Closed on
Feb 26, 1998
Sold by
Minch Randel Scott
Bought by
Lobner Daniel E
Home Financials for this Owner
Home Financials are based on the most recent Mortgage that was taken out on this home.
Original Mortgage
$71,000
Interest Rate
7.23%
Create a Home Valuation Report for This Property
The Home Valuation Report is an in-depth analysis detailing your home's value as well as a comparison with similar homes in the area
Home Values in the Area
Average Home Value in this Area
Purchase History
| Date | Buyer | Sale Price | Title Company |
|---|---|---|---|
| Seeling Gary | $90,000 | -- | |
| Meiter Edward G | $91,000 | -- | |
| Lobner Daniel E | $88,900 | Priority Title Corp |
Source: Public Records
Mortgage History
| Date | Status | Borrower | Loan Amount |
|---|---|---|---|
| Open | Seeling Gary | $60,000 | |
| Previous Owner | Meiter Edward G | $72,800 | |
| Previous Owner | Lobner Daniel E | $71,000 |
Source: Public Records
Tax History Compared to Growth
Tax History
| Year | Tax Paid | Tax Assessment Tax Assessment Total Assessment is a certain percentage of the fair market value that is determined by local assessors to be the total taxable value of land and additions on the property. | Land | Improvement |
|---|---|---|---|---|
| 2024 | $3,075 | $212,300 | $61,900 | $150,400 |
| 2023 | $2,975 | $212,300 | $61,900 | $150,400 |
| 2022 | $2,693 | $145,000 | $64,400 | $80,600 |
| 2021 | $2,743 | $145,000 | $64,400 | $80,600 |
| 2020 | $2,670 | $145,000 | $64,400 | $80,600 |
| 2019 | $2,576 | $145,000 | $64,400 | $80,600 |
| 2018 | $2,441 | $134,300 | $56,400 | $77,900 |
| 2017 | $2,448 | $134,300 | $56,400 | $77,900 |
| 2016 | $2,432 | $125,500 | $54,700 | $70,800 |
| 2015 | $2,422 | $125,500 | $54,700 | $70,800 |
| 2014 | $2,502 | $124,300 | $54,700 | $69,600 |
| 2013 | $2,502 | $124,300 | $54,700 | $69,600 |
Source: Public Records
Map
Nearby Homes
- 416 Bidwell Ave
- 511 N Washington Ave
- 317 Delafield St
- 707 W Moreland Blvd
- 1223 Wilshire Place
- 1508 Delafield St
- 169 NW Barstow St
- 1400 Summit Ave
- 1505 Elder St
- 245 S Hine Ave
- 100 E Main St Unit 403
- 100 E Main St Unit 307
- 608 N Grandview Blvd
- 331 Jasper Ln
- 1139 White Rock Ave
- 630 Westowne Ave
- 137 Wisconsin Ave
- 1954 Cascade Dr
- 512 E Main St
- 131 Wisconsin Ave
- 728 Delafield St
- 712 Delafield St
- 613 Lemira Ave
- 706 Delafield St
- 614 Lemira Ave
- 700 Delafield St
- 619 Lemira Ave
- 307 Lemira Ave
- 315 Lemira Ave
- 310 Lemira Ave
- 620 Lemira Ave
- 306 Lemira Ave
- 623 Lemira Ave
- 636 Delafield St
- 622 Delafield St
- 626 Lemira Ave
- 304 Prospect Ave
- 633 Delafield St
- 319 Lemira Ave
- 632 Delafield St