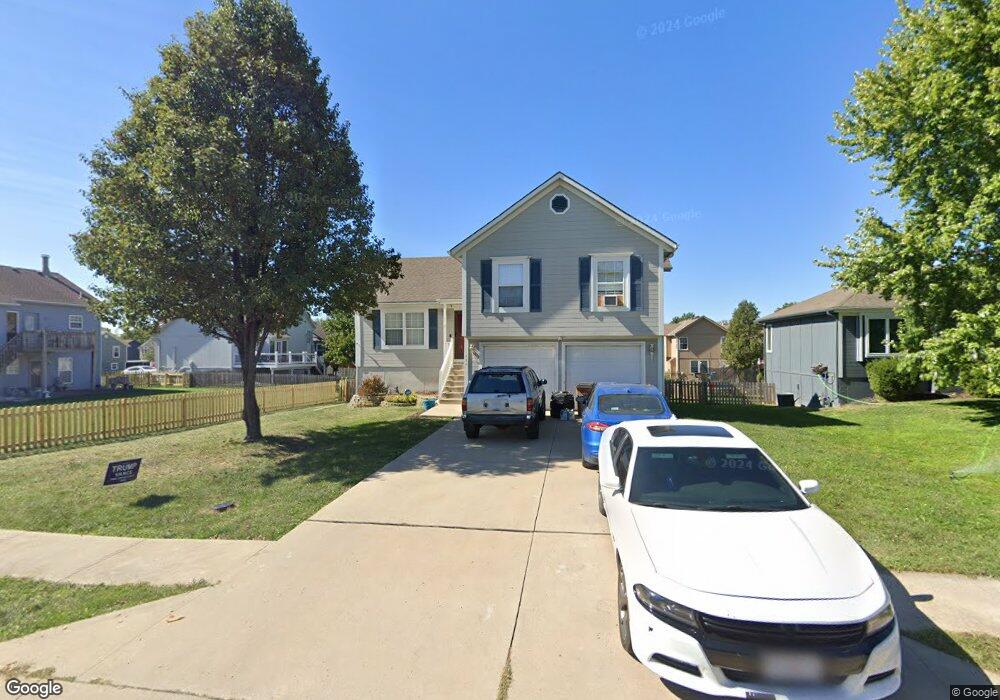
720 Furlong Dr Raymore, MO 64083
Estimated Value: $301,245 - $351,000
3
Beds
2
Baths
1,356
Sq Ft
$240/Sq Ft
Est. Value
About This Home
This home is located at 720 Furlong Dr, Raymore, MO 64083 and is currently estimated at $325,061, approximately $239 per square foot. 720 Furlong Dr is a home located in Cass County with nearby schools including Raymore Elementary School, Raymore-Peculiar East Middle School, and Raymore-Peculiar Senior High School.
Ownership History
Date
Name
Owned For
Owner Type
Purchase Details
Closed on
Dec 15, 2023
Sold by
Clark Richard B and Clark Dawn Marie
Bought by
Clark Richard B and Clark Dawn Marie
Current Estimated Value
Home Financials for this Owner
Home Financials are based on the most recent Mortgage that was taken out on this home.
Original Mortgage
$146,000
Outstanding Balance
$134,485
Interest Rate
6.76%
Mortgage Type
New Conventional
Estimated Equity
$190,576
Purchase Details
Closed on
Nov 29, 2012
Sold by
Clark Deborah K
Bought by
Clark Richard B
Create a Home Valuation Report for This Property
The Home Valuation Report is an in-depth analysis detailing your home's value as well as a comparison with similar homes in the area
Home Values in the Area
Average Home Value in this Area
Purchase History
| Date | Buyer | Sale Price | Title Company |
|---|---|---|---|
| Clark Richard B | -- | Trusted Title & Closing | |
| Clark Richard B | -- | None Available |
Source: Public Records
Mortgage History
| Date | Status | Borrower | Loan Amount |
|---|---|---|---|
| Open | Clark Richard B | $146,000 |
Source: Public Records
Tax History Compared to Growth
Tax History
| Year | Tax Paid | Tax Assessment Tax Assessment Total Assessment is a certain percentage of the fair market value that is determined by local assessors to be the total taxable value of land and additions on the property. | Land | Improvement |
|---|---|---|---|---|
| 2025 | $2,850 | $39,180 | $6,190 | $32,990 |
| 2024 | $2,850 | $35,020 | $5,630 | $29,390 |
| 2023 | $2,846 | $35,020 | $5,630 | $29,390 |
| 2022 | $2,557 | $31,260 | $5,630 | $25,630 |
| 2021 | $2,558 | $31,260 | $5,630 | $25,630 |
| 2020 | $2,512 | $30,160 | $5,630 | $24,530 |
| 2019 | $2,425 | $30,160 | $5,630 | $24,530 |
| 2018 | $2,186 | $26,250 | $4,690 | $21,560 |
| 2017 | $2,002 | $26,250 | $4,690 | $21,560 |
| 2016 | $2,002 | $24,960 | $4,690 | $20,270 |
| 2015 | $2,004 | $24,960 | $4,690 | $20,270 |
| 2014 | $2,005 | $24,960 | $4,690 | $20,270 |
| 2013 | -- | $24,960 | $4,690 | $20,270 |
Source: Public Records
Map
Nearby Homes
- 605 S Franklin St
- 808 Clancy Ct
- 512 S Washington St
- 901 W Lucy Webb Rd
- 507 S Washington St
- 1108 Yokley Dr
- 1112 Carlisle Dr
- 108 Rainbow Cir
- 105 N Lakeshore Dr
- 302 E Olive St
- 528 S Saturn Dr
- 526 S Saturn Dr
- 610 Roanke Dr
- 222 N Madison St
- 204 N Pointe Ln
- 112 W Grant Dr
- 1017 Johnston Dr
- 700 E Saturn Dr
- 221 N Pointe Ln
- 208 N Pacific Ct