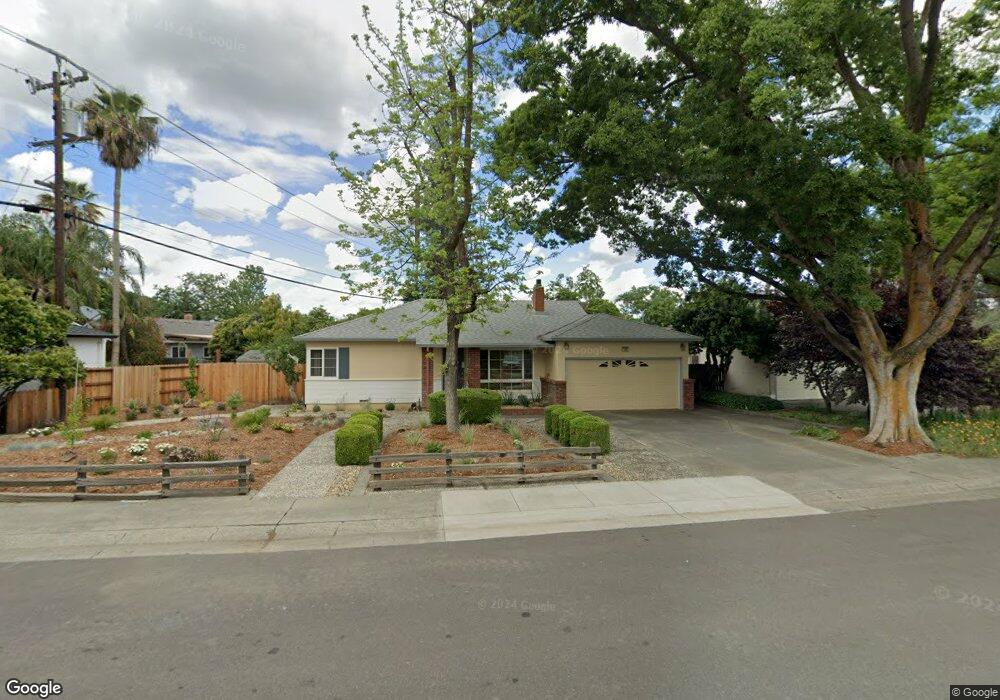
720 Hunt Way Davis, CA 95616
Central Davis NeighborhoodEstimated Value: $606,000 - $754,702
3
Beds
2
Baths
1,482
Sq Ft
$474/Sq Ft
Est. Value
About This Home
This home is located at 720 Hunt Way, Davis, CA 95616 and is currently estimated at $702,676, approximately $474 per square foot. 720 Hunt Way is a home located in Yolo County with nearby schools including North Davis Elementary School, Oliver Wendell Holmes Junior High School, and Davis Senior High School.
Ownership History
Date
Name
Owned For
Owner Type
Purchase Details
Closed on
Feb 1, 2023
Sold by
Heather Elko Mckibben Living Trust
Bought by
Heather Louise Elko Living Trust
Current Estimated Value
Purchase Details
Closed on
Aug 18, 2021
Sold by
Mckibben Heather Elko
Bought by
Mckibben Heather Elko and The Heather Elko Mckibben Livi
Purchase Details
Closed on
Aug 20, 2009
Sold by
Anquoe Karlene E and Estate Of Kathryn C Wilson
Bought by
Mckibben Scott W and Mckibben Heather Elko
Home Financials for this Owner
Home Financials are based on the most recent Mortgage that was taken out on this home.
Original Mortgage
$380,400
Interest Rate
5.17%
Mortgage Type
Purchase Money Mortgage
Purchase Details
Closed on
May 18, 1995
Sold by
Va
Bought by
Wilson Elmer W and Wilson Kathryn C
Create a Home Valuation Report for This Property
The Home Valuation Report is an in-depth analysis detailing your home's value as well as a comparison with similar homes in the area
Home Values in the Area
Average Home Value in this Area
Purchase History
| Date | Buyer | Sale Price | Title Company |
|---|---|---|---|
| Heather Louise Elko Living Trust | -- | None Listed On Document | |
| Mckibben Heather Elko | -- | None Available | |
| Mckibben Scott W | $475,500 | Placer Title Company | |
| Wilson Elmer W | -- | -- |
Source: Public Records
Mortgage History
| Date | Status | Borrower | Loan Amount |
|---|---|---|---|
| Previous Owner | Mckibben Scott W | $380,400 |
Source: Public Records
Tax History
| Year | Tax Paid | Tax Assessment Tax Assessment Total Assessment is a certain percentage of the fair market value that is determined by local assessors to be the total taxable value of land and additions on the property. | Land | Improvement |
|---|---|---|---|---|
| 2025 | $7,978 | $613,770 | $277,519 | $336,251 |
| 2023 | $7,978 | $589,939 | $266,744 | $323,195 |
| 2022 | $7,644 | $578,372 | $261,514 | $316,858 |
| 2021 | $7,466 | $567,033 | $256,387 | $310,646 |
| 2020 | $7,347 | $561,220 | $253,759 | $307,461 |
| 2019 | $7,023 | $550,217 | $248,784 | $301,433 |
| 2018 | $6,537 | $539,429 | $243,906 | $295,523 |
| 2017 | $6,401 | $528,853 | $239,124 | $289,729 |
| 2016 | $6,210 | $518,485 | $234,436 | $284,049 |
| 2015 | $5,993 | $510,698 | $230,915 | $279,783 |
| 2014 | $5,993 | $500,695 | $226,392 | $274,303 |
Source: Public Records
Map
Nearby Homes
Your Personal Tour Guide
Ask me questions while you tour the home.