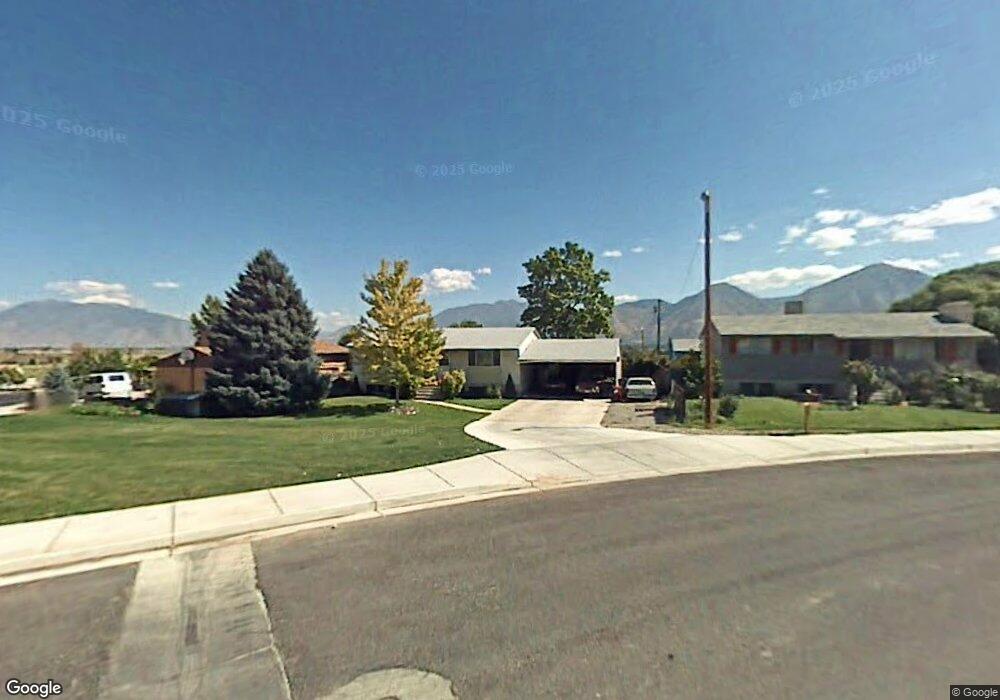
720 N 700 E Payson, UT 84651
Estimated Value: $367,000 - $456,000
4
Beds
1
Bath
2,080
Sq Ft
$204/Sq Ft
Est. Value
About This Home
This home is located at 720 N 700 E, Payson, UT 84651 and is currently estimated at $423,692, approximately $203 per square foot. 720 N 700 E is a home located in Utah County with nearby schools including Barnett Elementary School, Salem Junior High School, and Valley View Middle School.
Ownership History
Date
Name
Owned For
Owner Type
Purchase Details
Closed on
Feb 26, 2016
Sold by
Clark Loreta Ann and Warenski Rowslyn
Bought by
Brunger Reagan B
Current Estimated Value
Home Financials for this Owner
Home Financials are based on the most recent Mortgage that was taken out on this home.
Original Mortgage
$173,437
Outstanding Balance
$138,685
Interest Rate
4.37%
Mortgage Type
FHA
Estimated Equity
$285,007
Purchase Details
Closed on
Aug 6, 2013
Sold by
Clark Erma R
Bought by
Clark Erma R
Create a Home Valuation Report for This Property
The Home Valuation Report is an in-depth analysis detailing your home's value as well as a comparison with similar homes in the area
Home Values in the Area
Average Home Value in this Area
Purchase History
| Date | Buyer | Sale Price | Title Company |
|---|---|---|---|
| Brunger Reagan B | -- | Title West | |
| Clark Erma R | -- | None Available |
Source: Public Records
Mortgage History
| Date | Status | Borrower | Loan Amount |
|---|---|---|---|
| Open | Brunger Reagan B | $173,437 |
Source: Public Records
Tax History
| Year | Tax Paid | Tax Assessment Tax Assessment Total Assessment is a certain percentage of the fair market value that is determined by local assessors to be the total taxable value of land and additions on the property. | Land | Improvement |
|---|---|---|---|---|
| 2025 | $1,692 | $195,030 | -- | -- |
| 2024 | $1,692 | $172,150 | $0 | $0 |
| 2023 | $1,669 | $170,335 | $0 | $0 |
| 2022 | $1,885 | $189,200 | $0 | $0 |
| 2021 | $1,606 | $258,600 | $85,700 | $172,900 |
| 2020 | $1,523 | $239,800 | $77,900 | $161,900 |
| 2019 | $1,359 | $219,400 | $69,700 | $149,700 |
| 2018 | $1,271 | $197,800 | $62,300 | $135,500 |
| 2017 | $1,121 | $93,830 | $0 | $0 |
| 2016 | $1,079 | $89,760 | $0 | $0 |
| 2015 | $962 | $79,420 | $0 | $0 |
| 2014 | $873 | $72,655 | $0 | $0 |
Source: Public Records
Map
Nearby Homes
- 682 N 500 E
- 574 N 450 E
- 339 N 500 E Unit 3
- 327 N 500 E Unit 2
- 331 N 500 E Unit 2
- 446 N 460 E Unit 9
- 443 E 450 N
- 433 E 450 N
- 332 N 500 E
- 873 E 200 N
- 1058 E 100 N
- 1289 N Bamberger Rd
- 1287 N 1390 E Unit 25-96
- 1299 E 1670 N Unit 812
- 1299 E 1670 N
- 283 E 1250 N
- 283 E 1250 N Unit 64
- 603 900 N
- 1298 1670 N
- 420 N 150 W
Your Personal Tour Guide
Ask me questions while you tour the home.