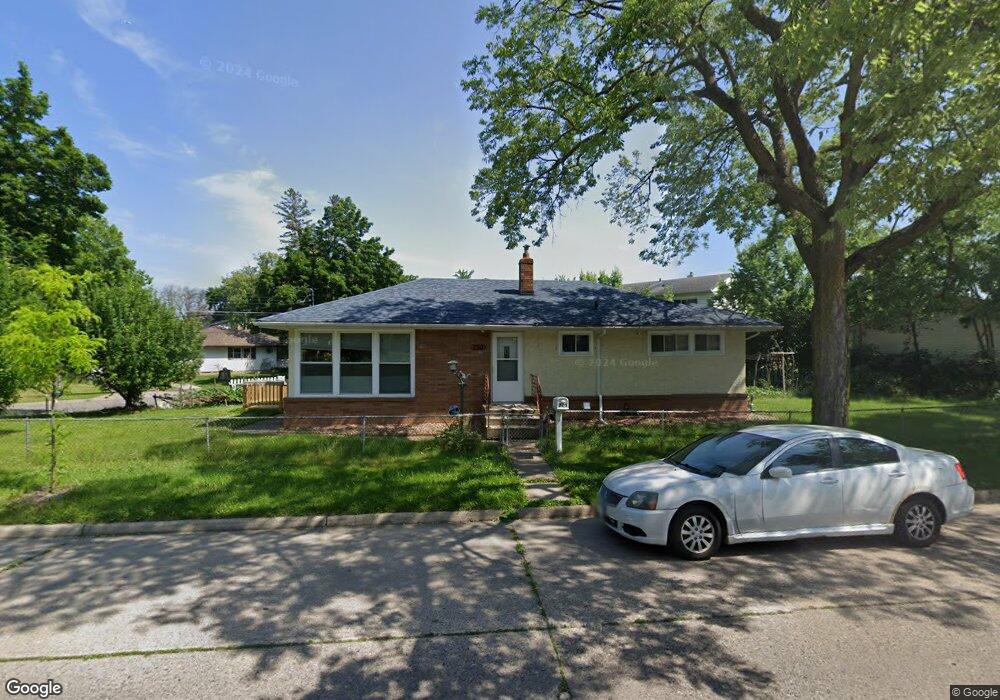
720 Parkway Dr Saint Paul, MN 55106
Payne-Phalen NeighborhoodEstimated Value: $289,000 - $328,000
4
Beds
2
Baths
2,112
Sq Ft
$145/Sq Ft
Est. Value
About This Home
This home is located at 720 Parkway Dr, Saint Paul, MN 55106 and is currently estimated at $306,416, approximately $145 per square foot. 720 Parkway Dr is a home located in Ramsey County with nearby schools including Bruce F Vento Elementary School, John A.Johnson Achievement Plus Elementary School, and Washington Technology Magnet School.
Ownership History
Date
Name
Owned For
Owner Type
Purchase Details
Closed on
Jun 1, 2021
Sold by
Reh Jae and Meh Prey
Bought by
Reh Poe
Current Estimated Value
Home Financials for this Owner
Home Financials are based on the most recent Mortgage that was taken out on this home.
Original Mortgage
$243,000
Outstanding Balance
$220,006
Interest Rate
2.9%
Mortgage Type
New Conventional
Estimated Equity
$86,410
Purchase Details
Closed on
Aug 28, 2019
Sold by
Vang Thada
Bought by
Reh Jae and Meh Tee
Home Financials for this Owner
Home Financials are based on the most recent Mortgage that was taken out on this home.
Original Mortgage
$221,350
Interest Rate
3.5%
Mortgage Type
New Conventional
Purchase Details
Closed on
Aug 12, 2019
Sold by
Vang Steve Koua
Bought by
Vang Thada
Home Financials for this Owner
Home Financials are based on the most recent Mortgage that was taken out on this home.
Original Mortgage
$221,350
Interest Rate
3.5%
Mortgage Type
New Conventional
Purchase Details
Closed on
Apr 27, 2000
Sold by
Duffy Jon F and Duffy Kim A
Bought by
Vang Steve and Sydaovone Thada
Purchase Details
Closed on
Oct 9, 1996
Sold by
Sam Hertog & Associates P S T
Bought by
Duffy Jon F
Create a Home Valuation Report for This Property
The Home Valuation Report is an in-depth analysis detailing your home's value as well as a comparison with similar homes in the area
Home Values in the Area
Average Home Value in this Area
Purchase History
| Date | Buyer | Sale Price | Title Company |
|---|---|---|---|
| Reh Poe | $274,000 | Title Llc | |
| Reh Jae | $235,000 | Titlesmart Inc | |
| Vang Thada | -- | Titlesmart Inc | |
| Vang Steve | $121,900 | -- | |
| Duffy Jon F | $56,005 | -- | |
| Reh Poe Poe | $274,000 | -- |
Source: Public Records
Mortgage History
| Date | Status | Borrower | Loan Amount |
|---|---|---|---|
| Open | Reh Poe | $243,000 | |
| Previous Owner | Reh Jae | $221,350 | |
| Closed | Reh Poe Poe | $274,000 |
Source: Public Records
Tax History Compared to Growth
Tax History
| Year | Tax Paid | Tax Assessment Tax Assessment Total Assessment is a certain percentage of the fair market value that is determined by local assessors to be the total taxable value of land and additions on the property. | Land | Improvement |
|---|---|---|---|---|
| 2025 | $4,078 | $278,300 | $30,000 | $248,300 |
| 2023 | $4,078 | $259,800 | $25,000 | $234,800 |
| 2022 | $3,696 | $255,000 | $25,000 | $230,000 |
| 2021 | $3,410 | $239,500 | $25,000 | $214,500 |
| 2020 | $2,914 | $230,000 | $17,800 | $212,200 |
| 2019 | $3,114 | $188,400 | $17,800 | $170,600 |
| 2018 | $2,796 | $179,500 | $17,800 | $161,700 |
| 2017 | $2,490 | $165,100 | $17,800 | $147,300 |
| 2016 | $2,356 | $0 | $0 | $0 |
| 2015 | $2,094 | $143,000 | $17,800 | $125,200 |
| 2014 | $1,610 | $0 | $0 | $0 |
Source: Public Records
Map
Nearby Homes
- 721 California Ave E
- 1615 Payne Ave
- 762 Maple Hills Dr E Unit C
- 692 Wheelock Pkwy E
- 727 Maple Hills Dr Unit A
- 529 Iowa Ave E
- 739 Maple Hills Dr E Unit H
- 760 Wheelock Pkwy E
- 1436 Payne Ave
- 1418 Payne Ave
- 1415 Payne Ave
- 662 Sherwood Ave
- 727 Cottage Ave E
- 1426 Burr St
- 685 Hyacinth Ave E
- 383 Nebraska Ave E
- 1477 Arkwright St Unit A
- 808 Hyacinth Ave E
- 1268 Payne Ave
- 740 Orange Ave E
- 726 Parkway Dr
- 691 Iowa Ave E
- 731 Parkway Dr
- 726 726 Parkway-Drive-
- 1612 Greenbrier St
- 725 Parkway Dr
- 725 725 Parkway-Drive-
- 727 Parkway Dr
- 1610 Greenbrier St
- 1610 Greenbrier St
- 1596 Greenbrier St
- 721 Parkway Dr
- 1592 Greenbrier St
- 1585 Greenbrier St
- 715 Parkway Dr
- 0 Greenbrier St Unit 4021422
- 714 Parkway Dr
- 714 Idaho Ave E
- 704 Iowa Ave E
- 719 Iowa Ave E