Estimated Value: $106,000 - $132,000
2
Beds
1
Bath
836
Sq Ft
$137/Sq Ft
Est. Value
About This Home
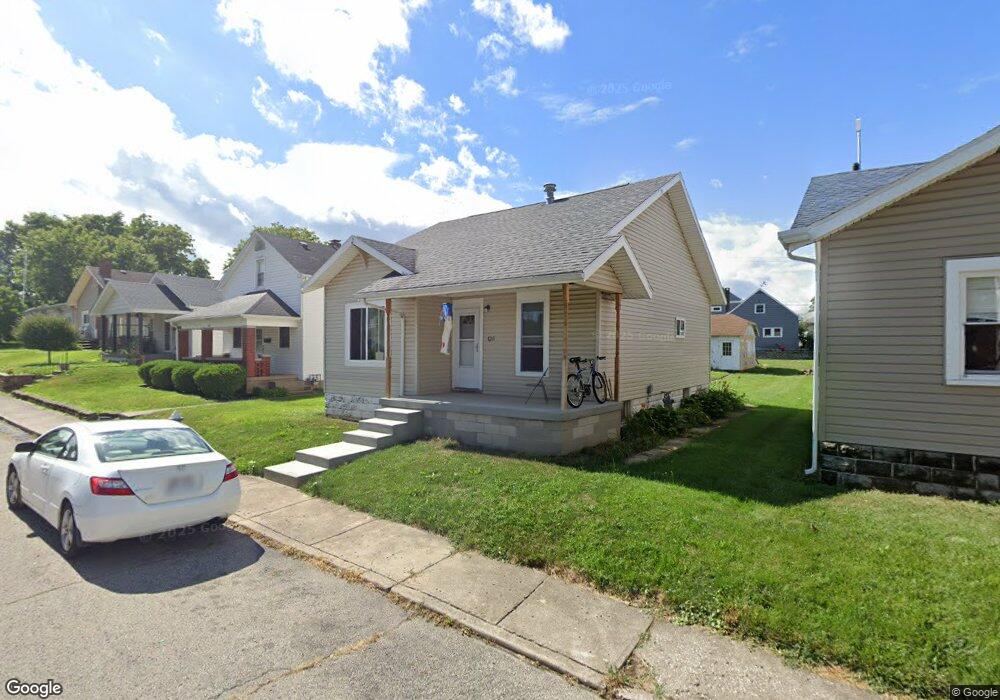
This home is located at 720 Vine St, Piqua, OH 45356 and is currently estimated at $114,865, approximately $137 per square foot. 720 Vine St is a home located in Miami County with nearby schools including Piqua Central Intermediate School, Springcreek Primary School, and Piqua Junior High School.
Ownership History
Date
Name
Owned For
Owner Type
Purchase Details
Closed on
Nov 4, 2010
Sold by
Fannie Mae
Bought by
Monnin Jason M
Current Estimated Value
Home Financials for this Owner
Home Financials are based on the most recent Mortgage that was taken out on this home.
Original Mortgage
$24,030
Outstanding Balance
$15,935
Interest Rate
4.37%
Mortgage Type
New Conventional
Estimated Equity
$98,930
Purchase Details
Closed on
Sep 3, 2010
Sold by
Weber Joshua M
Bought by
Federal National Mortgage Association
Purchase Details
Closed on
Jun 6, 2007
Sold by
Hud
Bought by
Weber Joshua M
Purchase Details
Closed on
Aug 31, 2006
Sold by
Cox Charles A and Eplet Marvin D
Bought by
Hud
Purchase Details
Closed on
Dec 17, 2002
Sold by
Sullenberger Phillip S and Sullenberger Brenda S
Bought by
Epley Marvin D and Epley Lori J
Home Financials for this Owner
Home Financials are based on the most recent Mortgage that was taken out on this home.
Original Mortgage
$81,352
Interest Rate
6.25%
Mortgage Type
FHA
Purchase Details
Closed on
May 14, 1991
Bought by
Jeffryes James Nelson
Create a Home Valuation Report for This Property
The Home Valuation Report is an in-depth analysis detailing your home's value as well as a comparison with similar homes in the area
Home Values in the Area
Average Home Value in this Area
Purchase History
| Date | Buyer | Sale Price | Title Company |
|---|---|---|---|
| Monnin Jason M | $27,000 | -- | |
| Federal National Mortgage Association | $36,000 | -- | |
| Weber Joshua M | -- | -- | |
| Hud | -- | -- | |
| Epley Marvin D | $82,000 | -- | |
| Jeffryes James Nelson | -- | -- |
Source: Public Records
Mortgage History
| Date | Status | Borrower | Loan Amount |
|---|---|---|---|
| Open | Epley Marvin D | $24,030 | |
| Previous Owner | Epley Marvin D | $81,352 |
Source: Public Records
Tax History Compared to Growth
Tax History
| Year | Tax Paid | Tax Assessment Tax Assessment Total Assessment is a certain percentage of the fair market value that is determined by local assessors to be the total taxable value of land and additions on the property. | Land | Improvement |
|---|---|---|---|---|
| 2024 | $992 | $23,530 | $8,090 | $15,440 |
| 2023 | $992 | $23,530 | $8,090 | $15,440 |
| 2022 | $931 | $21,710 | $8,090 | $13,620 |
| 2021 | $781 | $16,700 | $6,230 | $10,470 |
| 2020 | $768 | $16,700 | $6,230 | $10,470 |
| 2019 | $772 | $16,700 | $6,230 | $10,470 |
| 2018 | $694 | $14,320 | $6,480 | $7,840 |
| 2017 | $684 | $14,320 | $6,480 | $7,840 |
| 2016 | $676 | $14,320 | $6,480 | $7,840 |
| 2015 | $665 | $13,760 | $6,230 | $7,530 |
| 2014 | $665 | $13,760 | $6,230 | $7,530 |
| 2013 | $667 | $13,760 | $6,230 | $7,530 |
Source: Public Records
Map
Nearby Homes