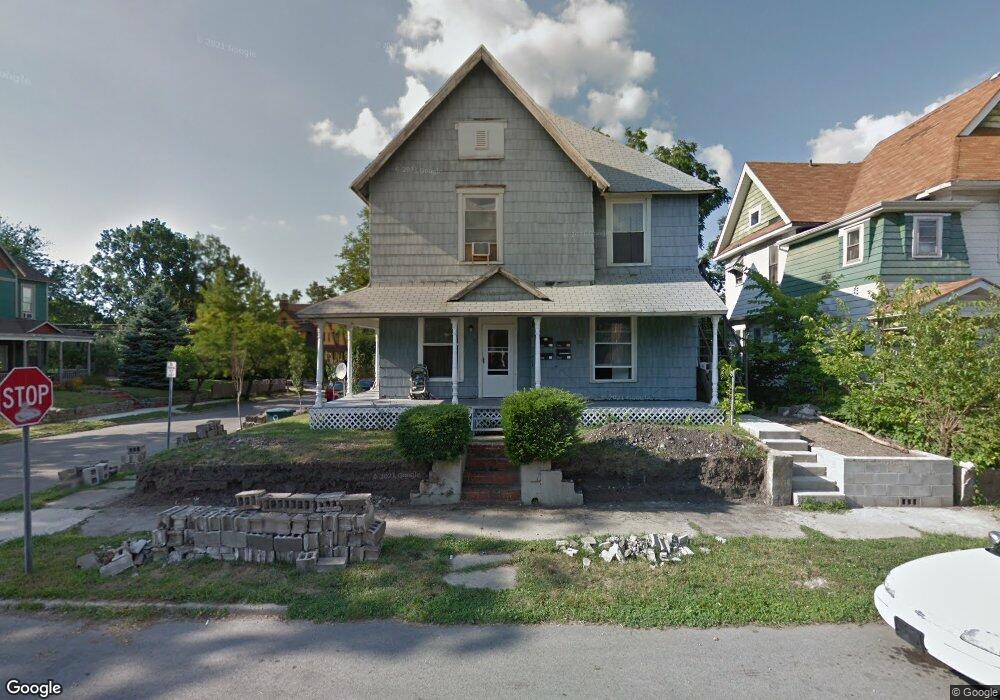
720 W Howard St Unit A-D Muncie, IN 47305
Old West End NeighborhoodEstimated Value: $83,000 - $106,000
4
Beds
4
Baths
3,132
Sq Ft
$30/Sq Ft
Est. Value
About This Home
This home is located at 720 W Howard St Unit A-D, Muncie, IN 47305 and is currently estimated at $95,000, approximately $30 per square foot. 720 W Howard St Unit A-D is a home located in Delaware County with nearby schools including Muncie Central High School, South View Elementary School, and Northside Middle School.
Ownership History
Date
Name
Owned For
Owner Type
Purchase Details
Closed on
Mar 10, 2023
Sold by
Smith Stephen
Bought by
New Age Homes Llc
Current Estimated Value
Purchase Details
Closed on
May 24, 2019
Sold by
Anderson Glen
Bought by
Madyja Llc
Purchase Details
Closed on
Jun 28, 2018
Sold by
Laderman Marvin
Bought by
Anderson Glen
Purchase Details
Closed on
Jul 16, 2008
Sold by
Carretti Leslie and Laderman Marvin
Bought by
Laderman Marvin
Purchase Details
Closed on
Sep 26, 2007
Sold by
Penny Foreclosures Iii Llc
Bought by
Carretti Leslie and Laderinan Marvin
Purchase Details
Closed on
Aug 21, 2007
Sold by
Greather Muncie Inc
Bought by
V
Purchase Details
Closed on
May 31, 2007
Sold by
Griffey Brenda Burnett
Bought by
Federal Home Loan Mortgage Corporation
Create a Home Valuation Report for This Property
The Home Valuation Report is an in-depth analysis detailing your home's value as well as a comparison with similar homes in the area
Home Values in the Area
Average Home Value in this Area
Purchase History
| Date | Buyer | Sale Price | Title Company |
|---|---|---|---|
| New Age Homes Llc | -- | Fidelity National Title | |
| Smith Stephen | -- | Fidelity National Title | |
| Madyja Llc | -- | None Available | |
| Anderson Glen | -- | None Available | |
| Laderman Marvin | -- | None Available | |
| Carretti Leslie | -- | None Available | |
| V | -- | None Available | |
| Federal Home Loan Mortgage Corporation | $25,000 | None Available |
Source: Public Records
Tax History Compared to Growth
Tax History
| Year | Tax Paid | Tax Assessment Tax Assessment Total Assessment is a certain percentage of the fair market value that is determined by local assessors to be the total taxable value of land and additions on the property. | Land | Improvement |
|---|---|---|---|---|
| 2024 | $1,502 | $69,700 | $2,100 | $67,600 |
| 2023 | $1,502 | $69,700 | $2,100 | $67,600 |
| 2022 | $1,518 | $70,500 | $2,100 | $68,400 |
| 2021 | $1,398 | $64,500 | $2,100 | $62,400 |
| 2020 | $1,398 | $64,500 | $2,100 | $62,400 |
| 2019 | $1,398 | $64,500 | $2,100 | $62,400 |
| 2018 | $1,394 | $64,300 | $2,100 | $62,200 |
| 2017 | $1,380 | $63,600 | $2,100 | $61,500 |
| 2016 | $1,380 | $63,600 | $2,100 | $61,500 |
| 2014 | $1,307 | $62,300 | $2,100 | $60,200 |
| 2013 | -- | $61,700 | $2,100 | $59,600 |
Source: Public Records
Map
Nearby Homes
- 502 S Mound St
- 725 W Charles St
- 312 S Gharkey St
- 925 W Powers St
- 305 S Proud St
- 303 S Proud St
- 27 W Orchard Place
- 429 W Charles St
- 415 W Howard St
- 1008 W 1st St
- 1024 W Powers St
- 411 - 413 W Adams St
- 407 W Adams St
- 1319 W Kilgore Ave
- 429 W 6th St
- 114 S Walnut St
- 114 S Walnut St Unit 100 & 200
- 1303 S Liberty St
- 216 S Dill St
- 1600 W Adams St
- 720 W Howard St
- 716 W Howard St
- 420 S Mound St
- 712 W Howard St
- 427 S Mound St
- 415 S Mound St
- 421 S Mound St
- 421 S Mound St Unit 2
- 708 W Howard St
- 715 W Howard St
- 721 W Howard St
- 425 S Mound St
- 709 W Howard St
- 801 W Charles St
- 711 W Charles St
- 700 W Howard St
- 411 S Gharkey St
- 705 W Howard St
- 805 W Charles St
- 820 W Howard St Unit .5