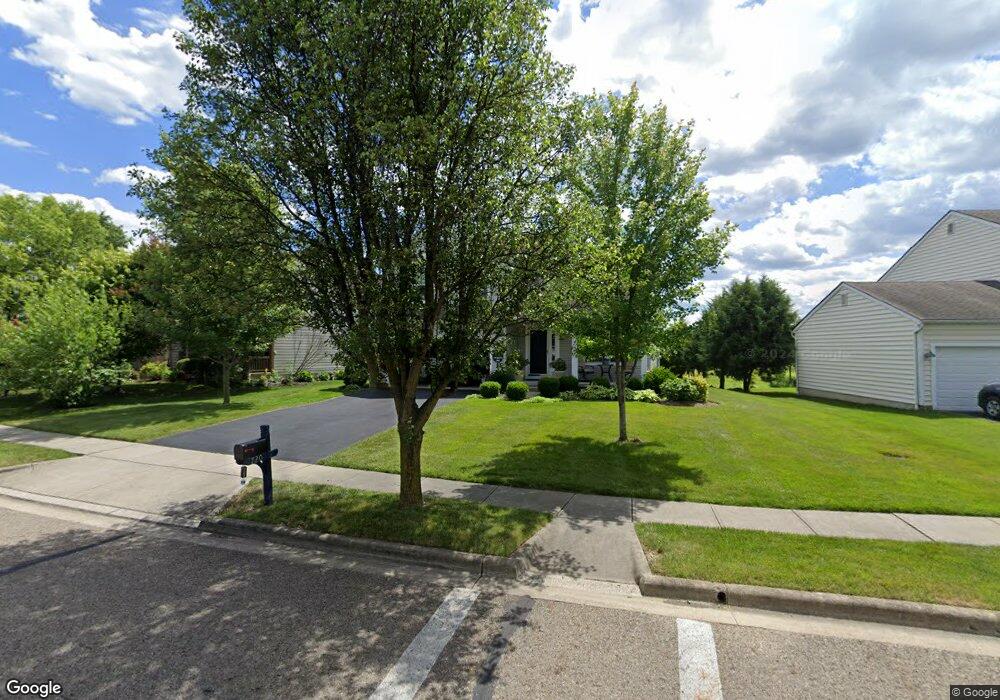
720 Woodington Dr Pataskala, OH 43062
Estimated Value: $355,000 - $371,000
4
Beds
3
Baths
1,798
Sq Ft
$202/Sq Ft
Est. Value
About This Home
This home is located at 720 Woodington Dr, Pataskala, OH 43062 and is currently estimated at $363,624, approximately $202 per square foot. 720 Woodington Dr is a home located in Licking County with nearby schools including North Elementary School, Licking Heights Central, and Licking Heights High School.
Ownership History
Date
Name
Owned For
Owner Type
Purchase Details
Closed on
Jul 6, 2006
Sold by
Jackson Alphonso R
Bought by
Schmitt Mark
Current Estimated Value
Home Financials for this Owner
Home Financials are based on the most recent Mortgage that was taken out on this home.
Original Mortgage
$135,000
Outstanding Balance
$80,279
Interest Rate
6.68%
Mortgage Type
Unknown
Estimated Equity
$283,345
Purchase Details
Closed on
Oct 14, 2003
Sold by
Marine Anne J
Bought by
Hud
Purchase Details
Closed on
Jul 8, 2002
Sold by
Centex Homes
Bought by
Marine Anne J
Home Financials for this Owner
Home Financials are based on the most recent Mortgage that was taken out on this home.
Original Mortgage
$179,341
Interest Rate
6.91%
Mortgage Type
FHA
Purchase Details
Closed on
Jul 11, 2001
Sold by
Dbi Land Co Llc
Bought by
Centex Homes & Kathy
Create a Home Valuation Report for This Property
The Home Valuation Report is an in-depth analysis detailing your home's value as well as a comparison with similar homes in the area
Home Values in the Area
Average Home Value in this Area
Purchase History
| Date | Buyer | Sale Price | Title Company |
|---|---|---|---|
| Schmitt Mark | $156,880 | Lakesid | |
| Hud | $135,000 | None Available | |
| Marine Anne J | $180,759 | -- | |
| Centex Homes & Kathy | $690,300 | -- |
Source: Public Records
Mortgage History
| Date | Status | Borrower | Loan Amount |
|---|---|---|---|
| Open | Schmitt Mark | $135,000 | |
| Previous Owner | Marine Anne J | $179,341 |
Source: Public Records
Tax History Compared to Growth
Tax History
| Year | Tax Paid | Tax Assessment Tax Assessment Total Assessment is a certain percentage of the fair market value that is determined by local assessors to be the total taxable value of land and additions on the property. | Land | Improvement |
|---|---|---|---|---|
| 2024 | $4,981 | $107,000 | $23,280 | $83,720 |
| 2023 | $5,201 | $107,000 | $23,280 | $83,720 |
| 2022 | $4,033 | $74,200 | $16,310 | $57,890 |
| 2021 | $4,110 | $74,200 | $16,310 | $57,890 |
| 2020 | $4,606 | $74,200 | $16,310 | $57,890 |
| 2019 | $4,147 | $61,990 | $11,660 | $50,330 |
| 2018 | $4,190 | $0 | $0 | $0 |
| 2017 | $4,288 | $0 | $0 | $0 |
| 2016 | $3,306 | $0 | $0 | $0 |
| 2015 | $3,152 | $0 | $0 | $0 |
| 2014 | $4,135 | $0 | $0 | $0 |
| 2013 | $3,325 | $0 | $0 | $0 |
Source: Public Records
Map
Nearby Homes
- 213 Kemperwood Dr
- 705 Woodington Dr
- 101 Barry Knoll Dr
- 5284 Taylor Rd SW
- 409 Lockmead Dr
- 14321 Havens Corners Rd SW
- 181 Brooksedge Dr
- 8803 Cicada St
- 605 Faith Ann Dr
- 6051 Taylor Rd SW
- 14160 Havens Corners Rd SW
- 1218 Cicada St
- 315 Cottage Grove Cir
- 823 Bent Oak Dr
- 0 Havens Corners Rd
- 316 Cottage Grove Cir
- 8641 Greylag St
- 7989 Aspen Ridge Dr
- 1208 Tannic St
- 540 Eisen Dr
- 724 Woodington Dr
- 716 Woodington Dr
- 324 Woodington Dr
- 728 Woodington Dr
- 712 Woodington Dr
- 721 Woodington Dr
- 732 Woodington Dr
- 708 Woodington Dr
- 725 Woodington Dr
- 729 Woodington Dr
- 704 Woodington Dr
- 736 Woodington Dr
- 719 Woodington Dr
- 733 Woodington Dr
- 205 Kemperwood Dr
- 715 Woodington Dr
- 204 Kemperwood Dr
- 711 Woodington Dr
- 737 Woodington Dr
- 740 Woodington Dr