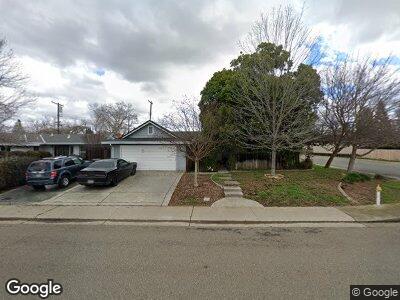
7200 Circlet Way Citrus Heights, CA 95621
Rusch Park NeighborhoodEstimated Value: $454,666 - $485,000
3
Beds
2
Baths
1,468
Sq Ft
$321/Sq Ft
Est. Value
About This Home
This home is located at 7200 Circlet Way, Citrus Heights, CA 95621 and is currently estimated at $471,167, approximately $320 per square foot. 7200 Circlet Way is a home located in Sacramento County with nearby schools including Arlington Heights Elementary School, Sylvan Middle School, and Mesa Verde High School.
Ownership History
Date
Name
Owned For
Owner Type
Purchase Details
Closed on
Jul 12, 2000
Sold by
Vickery Williams Tarra L and Vickery Wayne
Bought by
Williams Roger and Vickery Williams Tarra L
Current Estimated Value
Home Financials for this Owner
Home Financials are based on the most recent Mortgage that was taken out on this home.
Original Mortgage
$20,000
Interest Rate
8.55%
Mortgage Type
Credit Line Revolving
Purchase Details
Closed on
Dec 20, 1995
Sold by
Williams Roger
Bought by
Vickery Tarra L
Purchase Details
Closed on
Sep 28, 1994
Sold by
Smith Margaret B
Bought by
Vickery Tarra L and Vickery Wayne
Home Financials for this Owner
Home Financials are based on the most recent Mortgage that was taken out on this home.
Original Mortgage
$104,295
Interest Rate
8.55%
Mortgage Type
FHA
Create a Home Valuation Report for This Property
The Home Valuation Report is an in-depth analysis detailing your home's value as well as a comparison with similar homes in the area
Home Values in the Area
Average Home Value in this Area
Purchase History
| Date | Buyer | Sale Price | Title Company |
|---|---|---|---|
| Williams Roger | -- | Alliance Title Company | |
| Vickery Tarra L | -- | Old Republic Title Company | |
| Vickery Tarra L | $105,000 | Founders Title Company |
Source: Public Records
Mortgage History
| Date | Status | Borrower | Loan Amount |
|---|---|---|---|
| Open | Williams Roger | $172,800 | |
| Closed | Williams Roger | $184,000 | |
| Closed | Williams Roger | $195,360 | |
| Closed | Williams Roger | $50,500 | |
| Closed | Williams Roger | $47,000 | |
| Closed | Williams Roger | $150,000 | |
| Closed | Williams Roger | $20,000 | |
| Previous Owner | Vickery Tarra L | $104,295 |
Source: Public Records
Tax History Compared to Growth
Tax History
| Year | Tax Paid | Tax Assessment Tax Assessment Total Assessment is a certain percentage of the fair market value that is determined by local assessors to be the total taxable value of land and additions on the property. | Land | Improvement |
|---|---|---|---|---|
| 2024 | $2,086 | $172,794 | $52,840 | $119,954 |
| 2023 | $1,949 | $169,406 | $51,804 | $117,602 |
| 2022 | $1,938 | $166,086 | $50,789 | $115,297 |
| 2021 | $1,904 | $162,831 | $49,794 | $113,037 |
| 2020 | $1,868 | $161,162 | $49,284 | $111,878 |
| 2019 | $1,829 | $158,003 | $48,318 | $109,685 |
| 2018 | $1,806 | $154,906 | $47,371 | $107,535 |
| 2017 | $1,787 | $151,870 | $46,443 | $105,427 |
| 2016 | $1,668 | $148,893 | $45,533 | $103,360 |
| 2015 | $1,638 | $146,658 | $44,850 | $101,808 |
| 2014 | $1,603 | $143,786 | $43,972 | $99,814 |
Source: Public Records
Map
Nearby Homes
- 7105 Ansley Ct
- 7112 Circlet Way
- 6627 Creekmont Way
- 7042 van Maren Ln
- 7033 Enright Dr
- 7101 Wonner Way
- 7022 Zeeland Dr
- 7530 Garden Gate Dr
- 7251 Starflower Dr
- 7337 Brocade Dr
- 7044 Westchester Way
- 7021 Holland Ave
- 7542 Pomerol Ln
- 6907 Auburn Blvd
- 7744 Live Oak Way
- 6821 Susanna Ct
- 6937 Grand Tree Ln
- 6300 Tanbark Ct
- 7030 Daisy Ln
- 6608 Trailride Way
- 7200 Circlet Way
- 7208 Circlet Way
- 6805 Candelabra Dr
- 7140 Circlet Way
- 7216 Circlet Way
- 6804 Brougham Way
- 7201 Circlet Way
- 6809 Candelabra Dr
- 7209 Circlet Way
- 7125 Ansley Ct
- 6808 Brougham Way
- 7136 Circlet Way
- 7217 Circlet Way
- 7143 Circlet Way
- 6813 Candelabra Dr
- 7121 Ansley Ct
- 6812 Brougham Way
- 7232 Circlet Way
- 7225 Circlet Way
- 7200 van Maren Ln