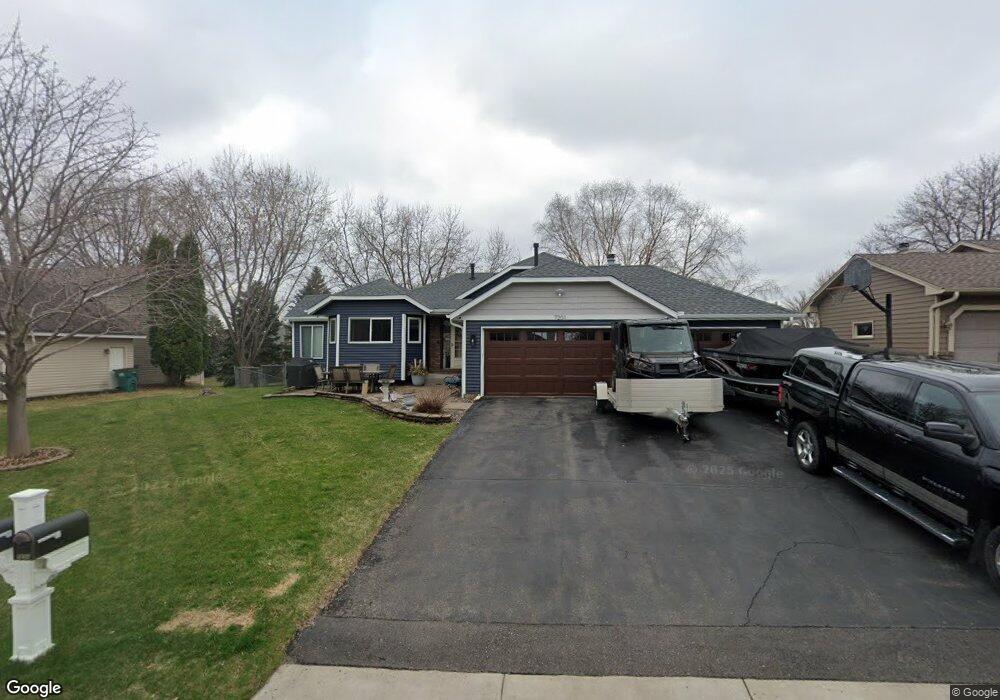
7201 7201 Deerwood-Lane-n Maple Grove, MN 55369
Estimated Value: $471,205 - $524,000
3
Beds
2
Baths
1,299
Sq Ft
$379/Sq Ft
Est. Value
About This Home
This home is located at 7201 7201 Deerwood-Lane-n, Maple Grove, MN 55369 and is currently estimated at $492,301, approximately $378 per square foot. 7201 7201 Deerwood-Lane-n is a home located in Hennepin County with nearby schools including Cedar Island Elementary School, Maple Grove Middle School, and Osseo Senior High School.
Ownership History
Date
Name
Owned For
Owner Type
Purchase Details
Closed on
Jul 29, 2016
Sold by
Ramsdell Travis Dean and Ramsdell Mona
Bought by
Gunderson Ross and Gunderson Ashley
Current Estimated Value
Home Financials for this Owner
Home Financials are based on the most recent Mortgage that was taken out on this home.
Original Mortgage
$260,000
Outstanding Balance
$207,851
Interest Rate
3.54%
Mortgage Type
New Conventional
Estimated Equity
$284,450
Purchase Details
Closed on
Jun 24, 2016
Sold by
Kempker Linda
Bought by
Ramsdell Travis and Ramsdell Mona
Home Financials for this Owner
Home Financials are based on the most recent Mortgage that was taken out on this home.
Original Mortgage
$260,000
Outstanding Balance
$207,851
Interest Rate
3.54%
Mortgage Type
New Conventional
Estimated Equity
$284,450
Purchase Details
Closed on
Mar 26, 2009
Sold by
Dreon James E and Dreon Gayle J
Bought by
Kempker Linda
Create a Home Valuation Report for This Property
The Home Valuation Report is an in-depth analysis detailing your home's value as well as a comparison with similar homes in the area
Home Values in the Area
Average Home Value in this Area
Purchase History
| Date | Buyer | Sale Price | Title Company |
|---|---|---|---|
| Gunderson Ross | $325,000 | Executive Title | |
| Ramsdell Travis | -- | Executive Title | |
| Kempker Linda | $250,000 | -- |
Source: Public Records
Mortgage History
| Date | Status | Borrower | Loan Amount |
|---|---|---|---|
| Open | Gunderson Ross | $260,000 |
Source: Public Records
Tax History Compared to Growth
Tax History
| Year | Tax Paid | Tax Assessment Tax Assessment Total Assessment is a certain percentage of the fair market value that is determined by local assessors to be the total taxable value of land and additions on the property. | Land | Improvement |
|---|---|---|---|---|
| 2024 | $3,394 | $428,200 | $128,000 | $300,200 |
| 2023 | $2,759 | $385,000 | $80,000 | $305,000 |
| 2022 | $2,456 | $397,400 | $87,600 | $309,800 |
| 2021 | $2,098 | $352,000 | $85,800 | $266,200 |
| 2020 | $2,078 | $318,900 | $67,600 | $251,300 |
| 2019 | $4,034 | $309,900 | $67,300 | $242,600 |
| 2018 | $3,865 | $301,000 | $68,500 | $232,500 |
| 2017 | $3,834 | $272,300 | $65,000 | $207,300 |
| 2016 | $3,894 | $272,400 | $75,000 | $197,400 |
| 2015 | $3,858 | $263,300 | $75,000 | $188,300 |
| 2014 | -- | $248,600 | $77,000 | $171,600 |
Source: Public Records
Map
Nearby Homes
- 11053 N Eagle Lake Blvd
- 6942 Ives Ln N
- 11081 69th Place N
- 7285 Kirkwood Ln N
- 11081 69th Ave N
- 7087 Wellington Ln N
- 12585 74th Ave N
- 12688 74th Ave N Unit 36
- 7486 Vinewood Ct Unit 7486
- 8154 Arrowwood Ln N
- 7536 Vinewood Ct
- 7577 Vinewood Ct
- 11462 81st Place N
- 11540 81st Place N
- 7331 Berkshire Way
- 7573 Wedgewood Way Unit 7573
- 11601 82nd Ave N
- 6220 Kirkwood Ln N
- 8406 Jonquil Ln N
- 12775 82nd Place N
- 7201 Deerwood Ln N
- 7189 Deerwood Ln N
- 7213 Deerwood Ln N
- 11607 72nd Ave N
- 11569 72nd Ave N
- 11615 72nd Ave N
- 11615 11615 72nd-Avenue-n
- 7167 Deerwood Ln N
- 7198 Deerwood Ln N
- 7210 Deerwood Ln N
- 7222 7222 Deerwood-Lane-n
- 7222 Deerwood Ln N
- 11526 72nd Ave N
- 11500 72nd Ave N
- 11623 72nd Ave N
- 11548 72nd Ave N
- 11448 71st Place N
- 7234 Deerwood Ln N
- 11590 72nd Ave N
- 11562 72nd Ave N