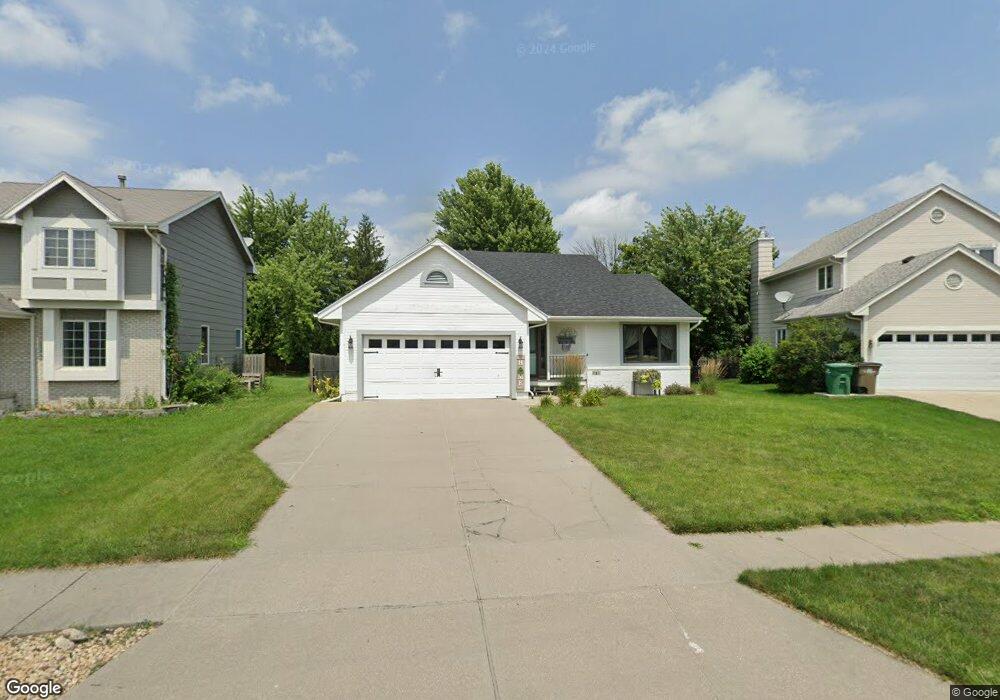
721 11th St SE Altoona, IA 50009
Estimated Value: $279,000 - $304,000
3
Beds
2
Baths
1,381
Sq Ft
$210/Sq Ft
Est. Value
About This Home
This home is located at 721 11th St SE, Altoona, IA 50009 and is currently estimated at $289,674, approximately $209 per square foot. 721 11th St SE is a home located in Polk County with nearby schools including Centennial Elementary School, Southeast Polk Spring Creek- 6th Grade, and Southeast Polk Junior High School.
Ownership History
Date
Name
Owned For
Owner Type
Purchase Details
Closed on
Jan 5, 2018
Sold by
Roekel Alvin H Van and Van Roekel Revocable T Alvin H
Bought by
Ploeger Steve and Ploeger Lynn
Current Estimated Value
Home Financials for this Owner
Home Financials are based on the most recent Mortgage that was taken out on this home.
Original Mortgage
$133,600
Outstanding Balance
$74,328
Interest Rate
3.92%
Mortgage Type
New Conventional
Estimated Equity
$215,346
Purchase Details
Closed on
Sep 29, 2015
Sold by
Dobie William J and Dobie Marla R
Bought by
Alvin H Van Roekel Revocable Trust and Roekel Alvin H
Purchase Details
Closed on
Aug 24, 2010
Sold by
Smith M E
Bought by
Johnson Walter A and Johnson Marie A
Purchase Details
Closed on
Nov 19, 1997
Sold by
Guiter Michael V and Guiter Sherri D
Bought by
Dobie William J and Dobie Marla R
Home Financials for this Owner
Home Financials are based on the most recent Mortgage that was taken out on this home.
Original Mortgage
$80,000
Interest Rate
6.96%
Create a Home Valuation Report for This Property
The Home Valuation Report is an in-depth analysis detailing your home's value as well as a comparison with similar homes in the area
Home Values in the Area
Average Home Value in this Area
Purchase History
| Date | Buyer | Sale Price | Title Company |
|---|---|---|---|
| Ploeger Steve | $167,000 | None Available | |
| Alvin H Van Roekel Revocable Trust | $175,000 | None Available | |
| Johnson Walter A | $129,500 | None Available | |
| Dobie William J | $118,000 | -- |
Source: Public Records
Mortgage History
| Date | Status | Borrower | Loan Amount |
|---|---|---|---|
| Open | Ploeger Steve | $133,600 | |
| Previous Owner | Dobie William J | $80,000 |
Source: Public Records
Tax History Compared to Growth
Tax History
| Year | Tax Paid | Tax Assessment Tax Assessment Total Assessment is a certain percentage of the fair market value that is determined by local assessors to be the total taxable value of land and additions on the property. | Land | Improvement |
|---|---|---|---|---|
| 2025 | $3,824 | $254,000 | $50,600 | $203,400 |
| 2024 | $3,824 | $232,400 | $45,700 | $186,700 |
| 2023 | $3,716 | $232,400 | $45,700 | $186,700 |
| 2022 | $3,668 | $191,000 | $39,000 | $152,000 |
| 2021 | $3,392 | $191,000 | $39,000 | $152,000 |
| 2020 | $3,332 | $168,800 | $34,400 | $134,400 |
| 2019 | $3,156 | $168,800 | $34,400 | $134,400 |
| 2018 | $3,342 | $157,300 | $31,000 | $126,300 |
| 2017 | $3,360 | $157,300 | $31,000 | $126,300 |
| 2016 | $3,150 | $143,300 | $27,600 | $115,700 |
| 2015 | $3,150 | $143,300 | $27,600 | $115,700 |
| 2014 | $3,250 | $145,000 | $27,800 | $117,200 |
Source: Public Records
Map
Nearby Homes
- 907 7th Ave SE Unit 1
- 725 11th St SE
- 909 7th Ave SE Unit 6
- 3424 5th Ave SE
- 3423 5th Ave SE
- 3406 5th Ave SE
- 3412 5th Ave SE
- 832 Red Hawk Way SE
- 1309 6th Ave SE
- 1308 9th Avenue Place SE
- 1211 10th Ave SE
- 605 6th Street Place SE
- 1206 3rd Ave SE
- 1411 4th Ave SE
- 1209 10th Avenue Place SE
- 946 11th Ave SE
- 103 12th St SE
- 707 18th St SE
- 400 4th St SE
- 603 1st Ave S
- 717 11th St SE
- 713 11th St SE
- 1104 8th Ave SE
- 729 11th St SE
- 709 11th St SE
- 1103 8th Ave SE
- 712 11th St SE
- 1108 8th Ave SE
- 907 7th Ave SE Unit 16
- 907 7th Ave SE Unit 15
- 907 7th Ave SE Unit 14
- 907 7th Ave SE Unit 13
- 907 7th Ave SE Unit 12
- 907 7th Ave SE Unit 11
- 907 7th Ave SE Unit 9
- 907 7th Ave SE Unit 8
- 907 7th Ave SE Unit 7
- 907 7th Ave SE Unit 6
- 907 7th Ave SE Unit 5
- 907 7th Ave SE Unit 4