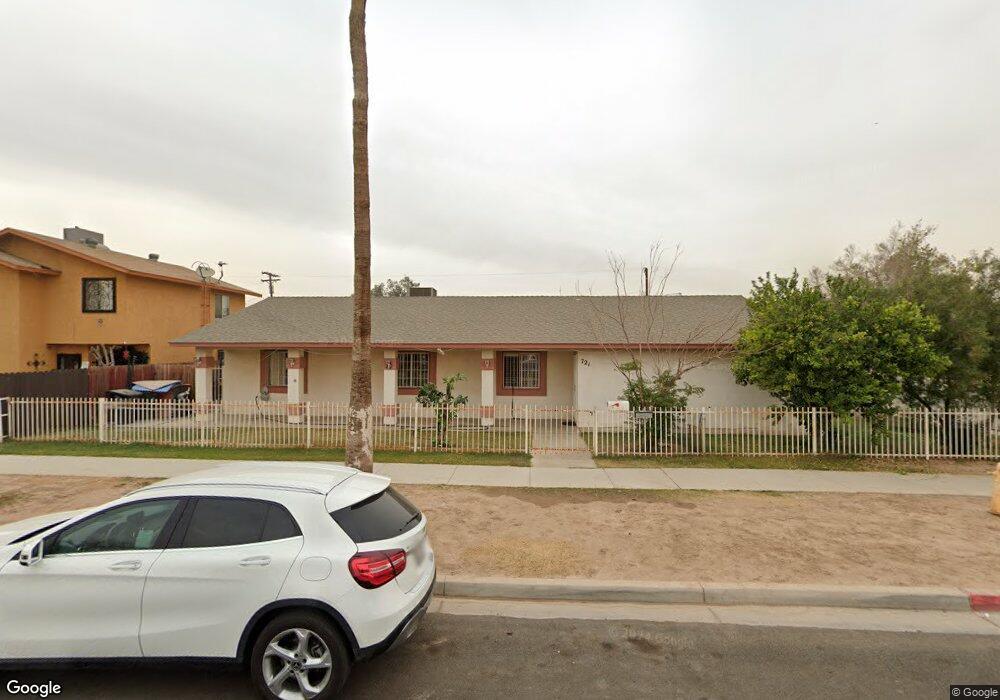
721 E 3rd St Calexico, CA 92231
Estimated Value: $302,000 - $384,452
4
Beds
2
Baths
1,970
Sq Ft
$173/Sq Ft
Est. Value
About This Home
This home is located at 721 E 3rd St, Calexico, CA 92231 and is currently estimated at $339,863, approximately $172 per square foot. 721 E 3rd St is a home located in Imperial County with nearby schools including Dool Elementary School, Enrique Camarena Junior High School, and Calexico High School.
Ownership History
Date
Name
Owned For
Owner Type
Purchase Details
Closed on
Aug 22, 2016
Sold by
Dek Khuy and Chaing Houng Kha
Bought by
Dek Khuy and Chaing Houng Kha
Current Estimated Value
Purchase Details
Closed on
Feb 26, 2009
Sold by
Aurora Loan Services Llc
Bought by
Dek Khuy and Chaing Houng Kha
Purchase Details
Closed on
Jul 31, 2008
Sold by
Villa Rigoberto and Villa Rita
Bought by
Aurora Loan Services Llc
Purchase Details
Closed on
Sep 17, 2003
Sold by
Esperanza Josefina Patricia
Bought by
Villa Rigoberto and Villa Rita
Home Financials for this Owner
Home Financials are based on the most recent Mortgage that was taken out on this home.
Original Mortgage
$137,837
Interest Rate
6.03%
Mortgage Type
FHA
Purchase Details
Closed on
Jun 17, 1999
Sold by
Cordero Alma L and Ayon Carlos
Bought by
Esperanza Josefina Patricia
Create a Home Valuation Report for This Property
The Home Valuation Report is an in-depth analysis detailing your home's value as well as a comparison with similar homes in the area
Purchase History
| Date | Buyer | Sale Price | Title Company |
|---|---|---|---|
| Dek Khuy | -- | None Available | |
| Dek Khuy | $104,000 | First American Title Company | |
| Aurora Loan Services Llc | $229,580 | Accommodation | |
| Villa Rigoberto | $140,000 | Chicago Title Co | |
| Esperanza Josefina Patricia | -- | -- |
Source: Public Records
Mortgage History
| Date | Status | Borrower | Loan Amount |
|---|---|---|---|
| Previous Owner | Villa Rigoberto | $137,837 | |
| Closed | Villa Rigoberto | $4,200 |
Source: Public Records
Tax History
| Year | Tax Paid | Tax Assessment Tax Assessment Total Assessment is a certain percentage of the fair market value that is determined by local assessors to be the total taxable value of land and additions on the property. | Land | Improvement |
|---|---|---|---|---|
| 2025 | $1,716 | $140,992 | $25,745 | $115,247 |
| 2023 | $1,716 | $135,520 | $24,747 | $110,773 |
| 2022 | $1,662 | $132,863 | $24,262 | $108,601 |
| 2021 | $1,613 | $130,259 | $23,787 | $106,472 |
| 2020 | $1,554 | $128,925 | $23,544 | $105,381 |
| 2019 | $1,509 | $126,398 | $23,083 | $103,315 |
| 2018 | $1,495 | $123,921 | $22,631 | $101,290 |
| 2017 | $1,387 | $121,492 | $22,188 | $99,304 |
| 2016 | $1,323 | $119,110 | $21,753 | $97,357 |
| 2015 | $1,301 | $117,322 | $21,427 | $95,895 |
| 2014 | $1,270 | $115,025 | $21,008 | $94,017 |
Source: Public Records
Map
Nearby Homes
- 618 E 5th St Unit B
- 618 E 5th St Unit A-B
- 737 Renaud Ct
- 510 E 3rd St
- 810 E 6th St
- 419 E 3rd St
- 415 E 3rd St
- 817 E 6th St
- 941 E 1st St
- 700 Blair Ave
- 1013 E 2nd St
- 816 Beach Ave
- 201 E Sherman St
- 631 Paulin Ave
- 21 E 7th St
- 21 E 7th St Unit 1
- 711 N Preston Dr
- 1070 Heber Ave
- 1061 Heber Ave
- 0 California 98
Your Personal Tour Guide
Ask me questions while you tour the home.