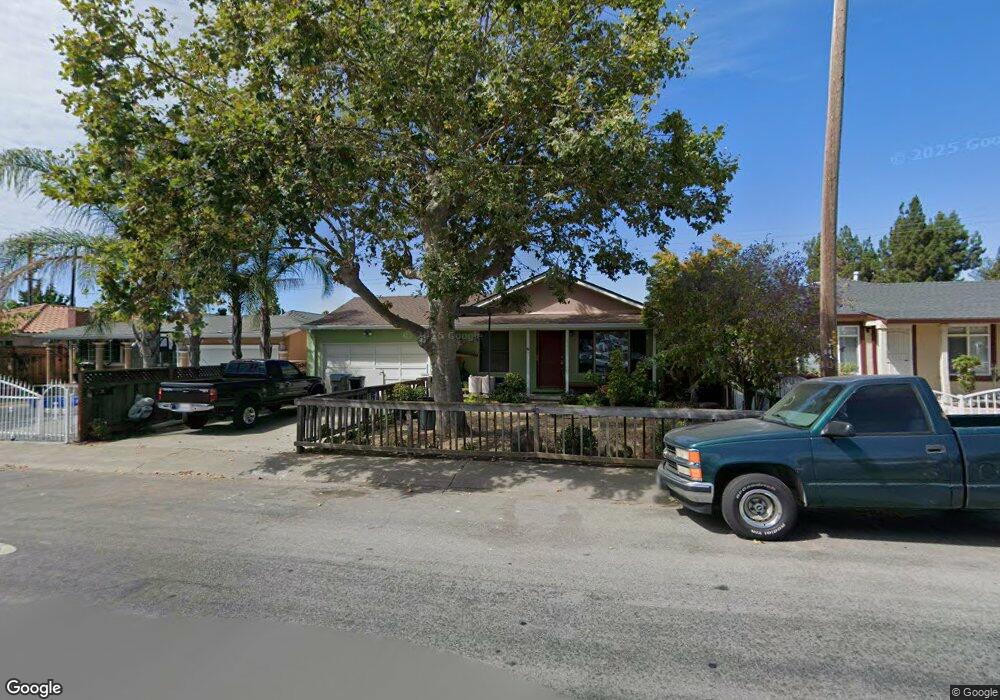
721 Gridley St San Jose, CA 95127
East Foothills NeighborhoodEstimated Value: $1,063,555 - $1,256,000
3
Beds
1
Bath
1,075
Sq Ft
$1,089/Sq Ft
Est. Value
About This Home
This home is located at 721 Gridley St, San Jose, CA 95127 and is currently estimated at $1,170,389, approximately $1,088 per square foot. 721 Gridley St is a home located in Santa Clara County with nearby schools including Toyon Elementary School, Piedmont Middle School, and Piedmont Hills High School.
Ownership History
Date
Name
Owned For
Owner Type
Purchase Details
Closed on
Mar 31, 2005
Sold by
Sayat Gary
Bought by
Sayat Remo and Sayat Rocelie
Current Estimated Value
Home Financials for this Owner
Home Financials are based on the most recent Mortgage that was taken out on this home.
Original Mortgage
$330,600
Outstanding Balance
$169,716
Interest Rate
5.7%
Mortgage Type
Stand Alone First
Estimated Equity
$1,000,673
Purchase Details
Closed on
Oct 1, 2003
Sold by
Cervantes Rudolpho and Cervantes Rachel
Bought by
Sayat Gary and Sayat Remo
Home Financials for this Owner
Home Financials are based on the most recent Mortgage that was taken out on this home.
Original Mortgage
$312,000
Interest Rate
4.87%
Mortgage Type
Balloon
Purchase Details
Closed on
Oct 25, 1993
Sold by
Fisher Brett C and Fisher Bridget M
Bought by
Cervantes Rudolpho and Cervantes Rachel
Create a Home Valuation Report for This Property
The Home Valuation Report is an in-depth analysis detailing your home's value as well as a comparison with similar homes in the area
Home Values in the Area
Average Home Value in this Area
Purchase History
| Date | Buyer | Sale Price | Title Company |
|---|---|---|---|
| Sayat Remo | -- | Fidelity National Title Ins | |
| Sayat Gary | $390,000 | Fidelity National Title Ins | |
| Cervantes Rudolpho | $182,500 | Old Republic Title Company |
Source: Public Records
Mortgage History
| Date | Status | Borrower | Loan Amount |
|---|---|---|---|
| Open | Sayat Remo | $330,600 | |
| Previous Owner | Sayat Gary | $312,000 |
Source: Public Records
Tax History Compared to Growth
Tax History
| Year | Tax Paid | Tax Assessment Tax Assessment Total Assessment is a certain percentage of the fair market value that is determined by local assessors to be the total taxable value of land and additions on the property. | Land | Improvement |
|---|---|---|---|---|
| 2025 | $9,328 | $629,075 | $364,972 | $264,103 |
| 2024 | $9,328 | $616,741 | $357,816 | $258,925 |
| 2023 | $9,153 | $604,649 | $350,800 | $253,849 |
| 2022 | $9,115 | $592,794 | $343,922 | $248,872 |
| 2021 | $8,814 | $581,172 | $337,179 | $243,993 |
| 2020 | $8,537 | $575,214 | $333,722 | $241,492 |
| 2019 | $8,212 | $563,936 | $327,179 | $236,757 |
| 2018 | $8,094 | $552,879 | $320,764 | $232,115 |
| 2017 | $8,137 | $542,039 | $314,475 | $227,564 |
| 2016 | $7,799 | $531,411 | $308,309 | $223,102 |
| 2015 | $7,443 | $499,400 | $289,700 | $209,700 |
| 2014 | $6,311 | $454,000 | $263,400 | $190,600 |
Source: Public Records
Map
Nearby Homes
- 636 Gridley St
- 3425 San Pablo Ave
- 3482 Golf Dr
- 673 Kirk Glen Dr
- 693 Kirk Glen Dr
- 3972 Pepper Tree Ln
- 3278 Faith Ct
- 550 Toyon Ave Unit 8
- 15018 San Pablo Ave
- 292 N Cragmont Ave
- 274 Vista Ave
- 770 Tallent Ave
- 15040 Penitencia Creek Rd
- 1068 Ondine Ct
- 4155 Holly Dr
- 0 El Grande Dr
- 2806 Glauser Dr
- 3101 Starburst Ct
- 3308 Whitman Way
- 207 N Claremont Ave