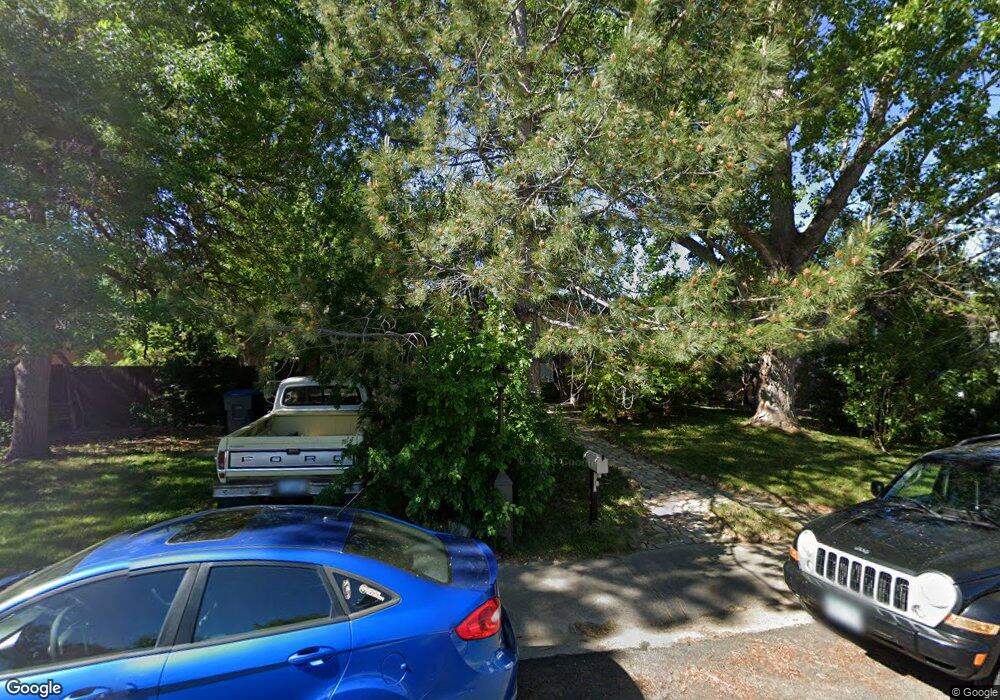
721 Hubbard Dr Longmont, CO 80504
Kensington NeighborhoodEstimated Value: $459,562 - $472,000
6
Beds
2
Baths
1,075
Sq Ft
$435/Sq Ft
Est. Value
About This Home
This home is located at 721 Hubbard Dr, Longmont, CO 80504 and is currently estimated at $467,391, approximately $434 per square foot. 721 Hubbard Dr is a home located in Boulder County with nearby schools including Rocky Mountain Elementary School, Trail Ridge Middle School, and Skyline High School.
Ownership History
Date
Name
Owned For
Owner Type
Purchase Details
Closed on
Aug 28, 1998
Sold by
Wallon David L and Wallon Sherri A
Bought by
Woodcock Trixie Larue
Current Estimated Value
Home Financials for this Owner
Home Financials are based on the most recent Mortgage that was taken out on this home.
Original Mortgage
$117,996
Outstanding Balance
$25,315
Interest Rate
6.95%
Mortgage Type
FHA
Estimated Equity
$442,076
Purchase Details
Closed on
Jul 26, 1994
Sold by
Affleck Jannis
Bought by
Wallon David L
Home Financials for this Owner
Home Financials are based on the most recent Mortgage that was taken out on this home.
Original Mortgage
$108,800
Interest Rate
8.3%
Mortgage Type
FHA
Purchase Details
Closed on
Nov 25, 1992
Bought by
Woodcock Trixie Larue
Purchase Details
Closed on
Jul 29, 1987
Bought by
Woodcock Trixie Larue
Create a Home Valuation Report for This Property
The Home Valuation Report is an in-depth analysis detailing your home's value as well as a comparison with similar homes in the area
Home Values in the Area
Average Home Value in this Area
Purchase History
| Date | Buyer | Sale Price | Title Company |
|---|---|---|---|
| Woodcock Trixie Larue | $119,000 | -- | |
| Wallon David L | $109,900 | -- | |
| Woodcock Trixie Larue | $75,500 | -- | |
| Woodcock Trixie Larue | $68,000 | -- |
Source: Public Records
Mortgage History
| Date | Status | Borrower | Loan Amount |
|---|---|---|---|
| Open | Woodcock Trixie Larue | $117,996 | |
| Previous Owner | Wallon David L | $108,800 |
Source: Public Records
Tax History Compared to Growth
Tax History
| Year | Tax Paid | Tax Assessment Tax Assessment Total Assessment is a certain percentage of the fair market value that is determined by local assessors to be the total taxable value of land and additions on the property. | Land | Improvement |
|---|---|---|---|---|
| 2025 | $2,441 | $26,913 | $10,688 | $16,225 |
| 2024 | $2,441 | $26,913 | $10,688 | $16,225 |
| 2023 | $2,408 | $25,520 | $11,732 | $17,474 |
| 2022 | $2,169 | $21,921 | $8,257 | $13,664 |
| 2021 | $2,197 | $22,551 | $8,494 | $14,057 |
| 2020 | $1,772 | $18,240 | $7,150 | $11,090 |
| 2019 | $1,744 | $18,240 | $7,150 | $11,090 |
| 2018 | $1,649 | $17,359 | $6,120 | $11,239 |
| 2017 | $1,626 | $19,192 | $6,766 | $12,426 |
| 2016 | $1,489 | $15,577 | $5,492 | $10,085 |
| 2015 | $1,419 | $12,545 | $3,980 | $8,565 |
| 2014 | $1,172 | $12,545 | $3,980 | $8,565 |
Source: Public Records
Map
Nearby Homes
- 448 Morgan Rd
- 405 Elliott St
- 618 Silver Star Ct
- 613 Rider Ridge Dr
- 631 Buchanan Ln
- 729 Brookside Dr
- 262 E 5th Ave
- 741 Elliott St
- 756 Brookside Dr
- 247 Wadsworth Cir
- 811 Brookside Dr
- 902 Sugar Mill Ave
- 908 Sugar Mill Ave
- 815 Hilltop St
- 1267 E 9th Ave
- 225 E 8th Ave Unit E20
- 225 E 8th Ave Unit A2
- 225 E 8th Ave Unit E10
- 28691 E 8th Ave
- 104 Rothrock Place