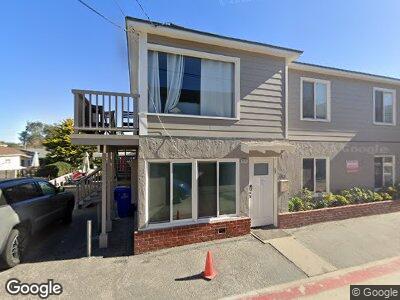
721 Kingston Ct San Diego, CA 92109
Mission Beach NeighborhoodEstimated Value: $1,061,000 - $1,763,000
2
Beds
1
Bath
720
Sq Ft
$2,045/Sq Ft
Est. Value
About This Home
This home is located at 721 Kingston Ct, San Diego, CA 92109 and is currently estimated at $1,472,484, approximately $2,045 per square foot. 721 Kingston Ct is a home located in San Diego County with nearby schools including Pacific Beach Elementary School, Pacific Beach Middle, and Mission Bay High School.
Ownership History
Date
Name
Owned For
Owner Type
Purchase Details
Closed on
Mar 26, 2025
Sold by
Eversz Laura B
Bought by
Laura B Eversz Revocable Trust and Eversz
Current Estimated Value
Purchase Details
Closed on
Mar 3, 2025
Sold by
Rodney Frederick Brown Separate Property and Eversz Laura B
Bought by
Eversz Laura B
Purchase Details
Closed on
Jul 5, 2023
Sold by
Brown Rodney Frederick
Bought by
Rodney Frederick Brown Separate Property Trus and Brown
Purchase Details
Closed on
Sep 17, 1998
Sold by
Rock Cassie D Trust Of 1992 and Cassie D
Bought by
Brown Rodney E
Home Financials for this Owner
Home Financials are based on the most recent Mortgage that was taken out on this home.
Original Mortgage
$169,400
Interest Rate
6.79%
Create a Home Valuation Report for This Property
The Home Valuation Report is an in-depth analysis detailing your home's value as well as a comparison with similar homes in the area
Home Values in the Area
Average Home Value in this Area
Purchase History
| Date | Buyer | Sale Price | Title Company |
|---|---|---|---|
| Laura B Eversz Revocable Trust | -- | None Listed On Document | |
| Eversz Laura B | -- | None Listed On Document | |
| Rodney Frederick Brown Separate Property Trus | -- | None Listed On Document | |
| Brown Rodney E | $242,000 | Chicago Title Co |
Source: Public Records
Mortgage History
| Date | Status | Borrower | Loan Amount |
|---|---|---|---|
| Previous Owner | Brown Rodney F | $153,000 | |
| Previous Owner | Brown Rodney F | $164,000 | |
| Previous Owner | Brown Rodney E | $169,400 |
Source: Public Records
Tax History Compared to Growth
Tax History
| Year | Tax Paid | Tax Assessment Tax Assessment Total Assessment is a certain percentage of the fair market value that is determined by local assessors to be the total taxable value of land and additions on the property. | Land | Improvement |
|---|---|---|---|---|
| 2024 | $4,619 | $371,926 | $276,333 | $95,593 |
| 2023 | $4,430 | $364,634 | $270,915 | $93,719 |
| 2022 | $4,310 | $357,485 | $265,603 | $91,882 |
| 2021 | $4,278 | $350,477 | $260,396 | $90,081 |
| 2020 | $4,224 | $346,884 | $257,726 | $89,158 |
| 2019 | $4,148 | $340,083 | $252,673 | $87,410 |
| 2018 | $3,960 | $333,416 | $247,719 | $85,697 |
| 2017 | $80 | $326,879 | $242,862 | $84,017 |
| 2016 | $3,812 | $320,470 | $238,100 | $82,370 |
| 2015 | $3,757 | $315,657 | $234,524 | $81,133 |
| 2014 | $3,694 | $309,474 | $229,930 | $79,544 |
Source: Public Records
Map
Nearby Homes
- 720 San Luis Obispo Place Unit D
- 814 Kingston Ct
- 811 Kennebeck Ct
- 819 Kennebeck Ct
- 719 Manhattan Ct Unit 21
- 815 Manhattan Ct
- 810 Santa Barbara Place
- 826 Jersey Ct
- 3255 Ocean Front Walk
- 3536-40 Bayside Walk
- 3581 Mission Blvd
- 817-817 1/2 Ormond Ct
- 3656 Bayside Walk
- 3719 Mission Blvd
- 821 Portsmouth Ct Unit E
- 3750 Bayside Walk Unit 6
- 3756-58 Mission Blvd Unit H,I,J,K,L
- 2999 Ocean Front Walk Unit 2
- 2999 Ocean Front Walk Unit 1
- 2990 Mission Blvd Unit 403
- 721 Kingston Ct
- 725 Kingston Ct Unit C
- 725 Kingston Ct
- 717 Kingston Ct
- 3364-70 Mission Blvd
- 3364 Mission Blvd
- 3361 Strandway Unit 67
- 3368 Missi Blvd
- 3368 Mission Blvd
- 718 Kingston Ct
- 722 Kingston Ct
- 726 Kingston Ct
- 3356 Mission Blvd
- 722 Kennebeck Ct
- 718 Kennebeck Ct
- 726 Kennebeck Ct
- 716 Kingston Ct
- 3366 Mission Blvd
- 714 Kennebeck Ct
- 3360 Mission Blvd