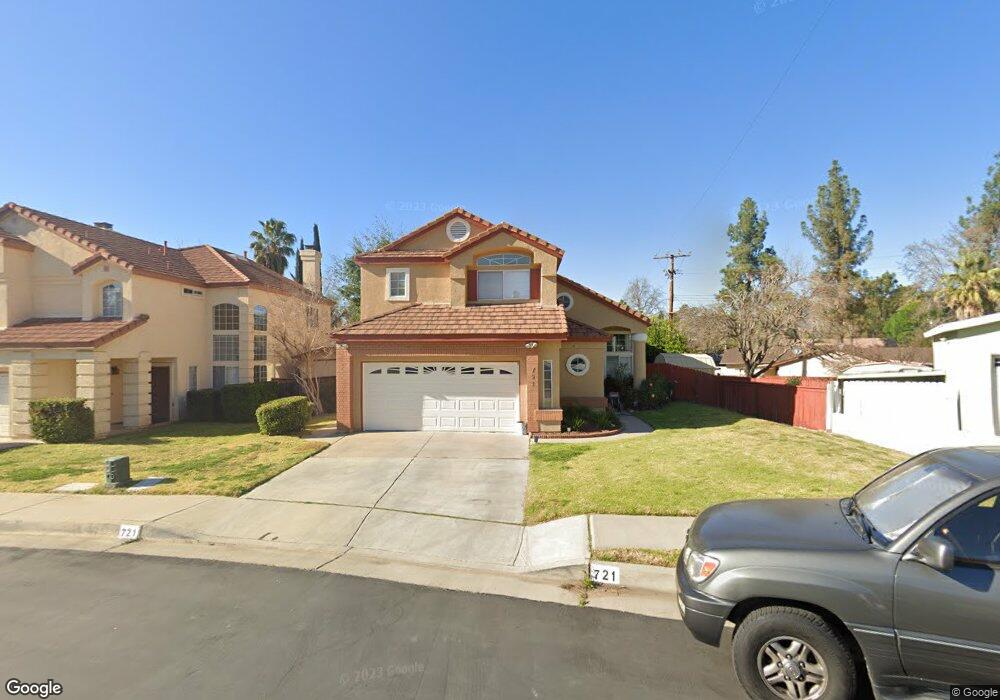
721 Napa Ave Redlands, CA 92374
South Redlands NeighborhoodEstimated Value: $664,000 - $730,000
4
Beds
3
Baths
2,019
Sq Ft
$340/Sq Ft
Est. Value
About This Home
This home is located at 721 Napa Ave, Redlands, CA 92374 and is currently estimated at $687,207, approximately $340 per square foot. 721 Napa Ave is a home located in San Bernardino County with nearby schools including Kingsbury Elementary School, Moore Middle School, and Redlands East Valley High School.
Ownership History
Date
Name
Owned For
Owner Type
Purchase Details
Closed on
Jun 27, 2007
Sold by
Bonus Albert E and Bonus Marina C
Bought by
Bonus Marina C and Bonus Albert E
Current Estimated Value
Home Financials for this Owner
Home Financials are based on the most recent Mortgage that was taken out on this home.
Original Mortgage
$120,000
Interest Rate
6.36%
Mortgage Type
Stand Alone Second
Purchase Details
Closed on
Mar 15, 2005
Sold by
Mclean Calvin M
Bought by
Bonus Albert E and Bonus Marina C
Home Financials for this Owner
Home Financials are based on the most recent Mortgage that was taken out on this home.
Original Mortgage
$320,000
Outstanding Balance
$161,048
Interest Rate
5.5%
Mortgage Type
Purchase Money Mortgage
Estimated Equity
$526,159
Purchase Details
Closed on
Feb 28, 2000
Sold by
Marrero Sonia
Bought by
Mclean Calvin M
Home Financials for this Owner
Home Financials are based on the most recent Mortgage that was taken out on this home.
Original Mortgage
$178,429
Interest Rate
8.26%
Mortgage Type
FHA
Purchase Details
Closed on
Dec 8, 1995
Sold by
Tiblier Mark V
Bought by
Marrero Sonia
Home Financials for this Owner
Home Financials are based on the most recent Mortgage that was taken out on this home.
Original Mortgage
$111,000
Interest Rate
7.04%
Create a Home Valuation Report for This Property
The Home Valuation Report is an in-depth analysis detailing your home's value as well as a comparison with similar homes in the area
Home Values in the Area
Average Home Value in this Area
Purchase History
| Date | Buyer | Sale Price | Title Company |
|---|---|---|---|
| Bonus Marina C | -- | Commerce Title Company | |
| Bonus Albert E | $400,000 | Nti | |
| Mclean Calvin M | $180,000 | Fidelity National Title | |
| Marrero Sonia | -- | First American Title Ins Co |
Source: Public Records
Mortgage History
| Date | Status | Borrower | Loan Amount |
|---|---|---|---|
| Closed | Bonus Marina C | $120,000 | |
| Open | Bonus Albert E | $320,000 | |
| Previous Owner | Mclean Calvin M | $178,429 | |
| Previous Owner | Marrero Sonia | $111,000 | |
| Closed | Bonus Albert E | $60,000 |
Source: Public Records
Tax History
| Year | Tax Paid | Tax Assessment Tax Assessment Total Assessment is a certain percentage of the fair market value that is determined by local assessors to be the total taxable value of land and additions on the property. | Land | Improvement |
|---|---|---|---|---|
| 2025 | $6,841 | $557,570 | $139,393 | $418,177 |
| 2024 | $6,385 | $546,637 | $136,660 | $409,977 |
| 2023 | $6,376 | $535,918 | $133,980 | $401,938 |
| 2022 | $6,282 | $525,410 | $131,353 | $394,057 |
| 2021 | $6,395 | $515,107 | $128,777 | $386,330 |
| 2020 | $6,107 | $494,400 | $148,300 | $346,100 |
| 2019 | $5,876 | $480,000 | $144,000 | $336,000 |
| 2018 | $5,705 | $468,800 | $141,100 | $327,700 |
| 2017 | $5,573 | $452,900 | $136,300 | $316,600 |
| 2016 | $5,249 | $423,300 | $127,400 | $295,900 |
| 2015 | $4,895 | $392,000 | $118,000 | $274,000 |
| 2014 | $4,901 | $392,000 | $118,000 | $274,000 |
Source: Public Records
Map
Nearby Homes
- 1032 Ardmore Cir
- 1089 Ardmore Cir
- 1049 Evergreen Ct
- 506 Lytle St
- 217 Judson St
- 15 Naomi St
- 455 Judson St Unit 9
- 1427 Laramie Ave
- 1200 E Highland Ave Unit 207
- 450 Judson St Unit 94
- 1442 Moore St
- 1479 Moore St
- 1452 Moore St
- 1458 Moore St
- 1476 Moore St
- 635 E Palm Ave
- 1410 Pleasantview Dr
- 61 Sparrow Ct
- 56 Dearborn Cir
- 1528 Laramie Ave
Your Personal Tour Guide
Ask me questions while you tour the home.