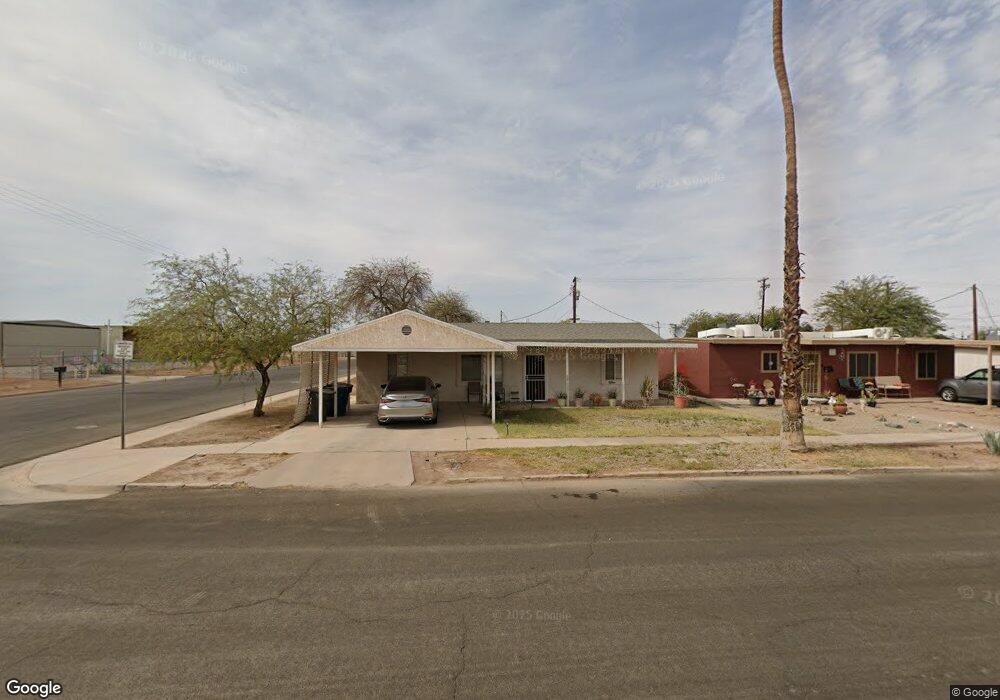
721 S G St Imperial, CA 92251
Estimated Value: $281,984 - $361,000
5
Beds
2
Baths
1,196
Sq Ft
$273/Sq Ft
Est. Value
About This Home
This home is located at 721 S G St, Imperial, CA 92251 and is currently estimated at $325,996, approximately $272 per square foot. 721 S G St is a home located in Imperial County with nearby schools including T.L. Waggoner Elementary School, Frank M. Wright Middle School, and Imperial High School.
Ownership History
Date
Name
Owned For
Owner Type
Purchase Details
Closed on
Feb 9, 2021
Sold by
Valenzuela Patricia A
Bought by
Valenzuela Patricia A and Valenzuela Emiliano Edward
Current Estimated Value
Purchase Details
Closed on
Jan 5, 2016
Sold by
Valenzuela Frank B
Bought by
Valenzuela Patricia A
Purchase Details
Closed on
May 23, 2012
Sold by
Valenzuela Frank B
Bought by
Valenzuela Patricia A
Purchase Details
Closed on
May 31, 2006
Sold by
Valenzuela Frank B and Valenzuela Rose
Bought by
Valenzuela Frank B and Valenzuela Rose
Purchase Details
Closed on
May 22, 2002
Sold by
Valenzuela Frank B and Valenzuela Rose E
Bought by
Valenzuela Frank B and Valenzuela Rose E
Create a Home Valuation Report for This Property
The Home Valuation Report is an in-depth analysis detailing your home's value as well as a comparison with similar homes in the area
Home Values in the Area
Average Home Value in this Area
Purchase History
| Date | Buyer | Sale Price | Title Company |
|---|---|---|---|
| Valenzuela Patricia A | -- | None Available | |
| Valenzuela Patricia A | -- | None Available | |
| Valenzuela Patricia A | -- | None Available | |
| Valenzuela Frank B | -- | None Available | |
| Valenzuela Frank B | -- | -- |
Source: Public Records
Tax History Compared to Growth
Tax History
| Year | Tax Paid | Tax Assessment Tax Assessment Total Assessment is a certain percentage of the fair market value that is determined by local assessors to be the total taxable value of land and additions on the property. | Land | Improvement |
|---|---|---|---|---|
| 2025 | $467 | $49,398 | $8,534 | $40,864 |
| 2023 | $467 | $47,481 | $8,203 | $39,278 |
| 2022 | $454 | $46,551 | $8,043 | $38,508 |
| 2021 | $446 | $45,639 | $7,886 | $37,753 |
| 2020 | $441 | $45,172 | $7,806 | $37,366 |
| 2019 | $433 | $44,287 | $7,653 | $36,634 |
| 2018 | $426 | $43,419 | $7,503 | $35,916 |
| 2017 | $400 | $42,568 | $7,356 | $35,212 |
| 2016 | $384 | $41,734 | $7,212 | $34,522 |
| 2015 | $387 | $41,108 | $7,104 | $34,004 |
| 2014 | $361 | $40,303 | $6,965 | $33,338 |
Source: Public Records
Map
Nearby Homes