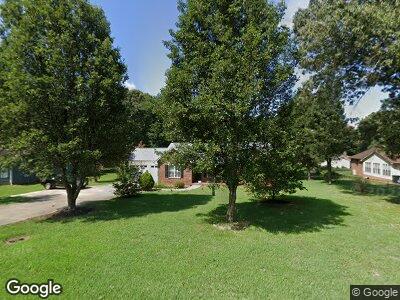
721 Walker Branch Rd Lincolnton, NC 28092
Estimated Value: $316,000 - $347,000
3
Beds
2
Baths
1,622
Sq Ft
$202/Sq Ft
Est. Value
About This Home
This home is located at 721 Walker Branch Rd, Lincolnton, NC 28092 and is currently estimated at $328,224, approximately $202 per square foot. 721 Walker Branch Rd is a home located in Lincoln County with nearby schools including G.E. Massey Elementary School, Lincolnton Middle School, and Lincolnton High School.
Ownership History
Date
Name
Owned For
Owner Type
Purchase Details
Closed on
Jun 3, 2008
Sold by
Secretary Of Housing & Urban Development
Bought by
Bowman Dennis M and Bowman Vicky E
Current Estimated Value
Home Financials for this Owner
Home Financials are based on the most recent Mortgage that was taken out on this home.
Original Mortgage
$137,930
Interest Rate
6.04%
Mortgage Type
VA
Purchase Details
Closed on
Nov 12, 2007
Sold by
Wong Victor M and Sabario Maritza S
Bought by
Secretary Of Housing And Urban Developme
Purchase Details
Closed on
Apr 27, 2000
Bought by
Wong Victor M and Wong Maritza S
Purchase Details
Closed on
Sep 25, 1998
Bought by
Masucci Dennis D and Masucci Wanda J
Purchase Details
Closed on
Jun 11, 1997
Bought by
Scates Robert E and Scates Donna J
Create a Home Valuation Report for This Property
The Home Valuation Report is an in-depth analysis detailing your home's value as well as a comparison with similar homes in the area
Home Values in the Area
Average Home Value in this Area
Purchase History
| Date | Buyer | Sale Price | Title Company |
|---|---|---|---|
| Bowman Dennis M | -- | None Available | |
| Secretary Of Housing And Urban Developme | $128,720 | None Available | |
| Wong Victor M | $127,000 | -- | |
| Masucci Dennis D | $126,000 | -- | |
| Scates Robert E | $10,000 | -- |
Source: Public Records
Mortgage History
| Date | Status | Borrower | Loan Amount |
|---|---|---|---|
| Open | Bowman Dennis M | $121,714 | |
| Closed | Bowman Dennis M | $124,882 | |
| Closed | Bowman Dennis M | $130,443 | |
| Closed | Bowman Dennis M | $139,030 | |
| Closed | Bowman Dennis M | $137,930 |
Source: Public Records
Tax History Compared to Growth
Tax History
| Year | Tax Paid | Tax Assessment Tax Assessment Total Assessment is a certain percentage of the fair market value that is determined by local assessors to be the total taxable value of land and additions on the property. | Land | Improvement |
|---|---|---|---|---|
| 2024 | $1,749 | $261,136 | $34,000 | $227,136 |
| 2023 | $1,744 | $261,136 | $34,000 | $227,136 |
| 2022 | $1,425 | $176,045 | $24,000 | $152,045 |
| 2021 | $1,425 | $176,045 | $24,000 | $152,045 |
| 2020 | $1,275 | $176,045 | $24,000 | $152,045 |
| 2019 | $1,239 | $176,045 | $24,000 | $152,045 |
| 2018 | $1,249 | $160,346 | $23,000 | $137,346 |
| 2017 | $1,140 | $160,346 | $23,000 | $137,346 |
| 2016 | $1,140 | $160,346 | $23,000 | $137,346 |
| 2015 | $1,203 | $160,346 | $23,000 | $137,346 |
| 2014 | $1,246 | $168,447 | $25,500 | $142,947 |
Source: Public Records
Map
Nearby Homes
- 1235 Wilma Sigmon Rd
- 1142 Foxberry Rd
- 920 Hunting Ave
- 00 Walker Branch Rd
- 329 Highland Dr
- Lot 51 Hares Way
- Lot 49 Hares Way
- Lot 50 Hares Way
- 367 Turner St Unit 6
- 314 Little St
- 2203 Arney St
- 312 Shady Ln
- 134 Olivia Ln
- 00 Shell St
- 00 Roper Dr
- 172 Salem Church Rd
- 2209 Dale Ave
- 107 Doris Ct
- 00 Eastview Dr
- LOT 9 Willow Ridge Rd
- 721 Walker Branch Rd
- 709 Walker Branch Rd
- 813 Hunting Ave
- 800 Hunting Ave
- 734 Walker Branch Rd
- 704 Walker Branch Rd
- 819 Hunting Ave
- 748 Walker Branch Rd
- 694 Walker Branch Rd
- 1379 Wilma Sigmon Rd
- 767 Walker Branch Rd
- 756 Walker Branch Rd
- 833 Hunting Ave
- 770 Walker Branch Rd
- 1347 Wilma Sigmon Rd
- 845 Hunting Ave
- 778 Walker Branch Rd
- 664 Walker Branch Rd
- 844 Hunting Ave
- 1339 Wilma Sigmon Rd