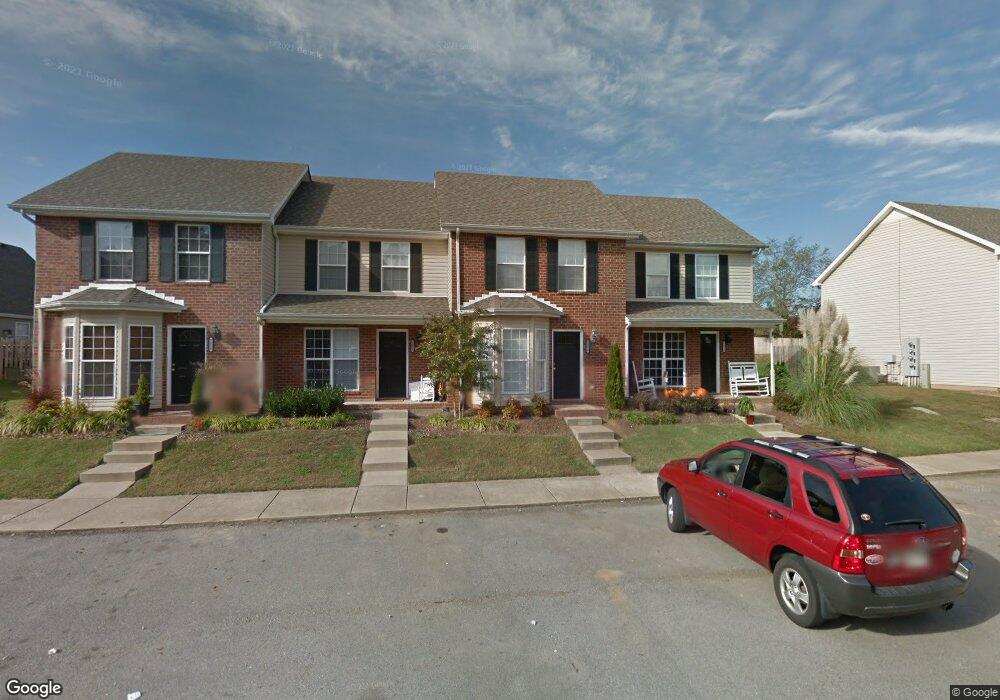
7214 Rosemary Ct Unit 11 Fairview, TN 37062
Estimated Value: $259,935 - $281,000
--
Bed
2
Baths
1,018
Sq Ft
$265/Sq Ft
Est. Value
About This Home
This home is located at 7214 Rosemary Ct Unit 11, Fairview, TN 37062 and is currently estimated at $269,645, approximately $264 per square foot. 7214 Rosemary Ct Unit 11 is a home located in Williamson County with nearby schools including Westwood Elementary School, Fairview Middle School, and Fairview High School.
Ownership History
Date
Name
Owned For
Owner Type
Purchase Details
Closed on
Mar 29, 2010
Sold by
Parker Seth M
Bought by
Secretary Of Housing & Urban Development
Current Estimated Value
Purchase Details
Closed on
May 30, 2007
Sold by
Mangrum Bonnie E
Bought by
Parker Seth M
Home Financials for this Owner
Home Financials are based on the most recent Mortgage that was taken out on this home.
Original Mortgage
$94,254
Interest Rate
6.12%
Mortgage Type
FHA
Purchase Details
Closed on
Oct 18, 2005
Sold by
Smithson T E and Smithson Debbie Lee
Bought by
Mangrum Bonnie E
Home Financials for this Owner
Home Financials are based on the most recent Mortgage that was taken out on this home.
Original Mortgage
$89,900
Interest Rate
5.66%
Mortgage Type
Fannie Mae Freddie Mac
Create a Home Valuation Report for This Property
The Home Valuation Report is an in-depth analysis detailing your home's value as well as a comparison with similar homes in the area
Home Values in the Area
Average Home Value in this Area
Purchase History
| Date | Buyer | Sale Price | Title Company |
|---|---|---|---|
| Secretary Of Housing & Urban Development | $98,237 | None Available | |
| Parker Seth M | $95,000 | Homeplace Title Llc | |
| Mangrum Bonnie E | $89,900 | -- |
Source: Public Records
Mortgage History
| Date | Status | Borrower | Loan Amount |
|---|---|---|---|
| Previous Owner | Parker Seth M | $94,254 | |
| Previous Owner | Mangrum Bonnie E | $89,900 |
Source: Public Records
Tax History Compared to Growth
Tax History
| Year | Tax Paid | Tax Assessment Tax Assessment Total Assessment is a certain percentage of the fair market value that is determined by local assessors to be the total taxable value of land and additions on the property. | Land | Improvement |
|---|---|---|---|---|
| 2025 | $1,093 | $59,425 | $17,000 | $42,425 |
| 2024 | $1,093 | $39,650 | $7,500 | $32,150 |
| 2023 | $0 | $39,650 | $7,500 | $32,150 |
| 2022 | $1,093 | $39,650 | $7,500 | $32,150 |
| 2021 | $745 | $39,650 | $7,500 | $32,150 |
| 2020 | $577 | $26,000 | $4,125 | $21,875 |
| 2019 | $577 | $26,000 | $4,125 | $21,875 |
| 2018 | $559 | $26,000 | $4,125 | $21,875 |
| 2017 | $554 | $26,000 | $4,125 | $21,875 |
| 2016 | $0 | $26,000 | $4,125 | $21,875 |
| 2015 | -- | $24,000 | $3,750 | $20,250 |
| 2014 | -- | $24,000 | $3,750 | $20,250 |
Source: Public Records
Map
Nearby Homes
- 7203 Rosemary Ct Unit 2
- 7206 Rosemary Ct Unit 7
- 7216 Glenwood Dr
- 7203 Blue Ridge Dr
- 7153 Kingwood Blvd
- 7129 Mapleside Ln
- Hemingway Plan at Adam's Preserve
- Grisham Plan at Adam's Preserve
- 7112 Mapleside Ln
- 7116 Mapleside Ln
- 7120 Mapleside Ln
- 7130 Mapleside Ln
- 7148 Mapleside Ln
- 7159 Mapleside Ln
- 7431 Old Nashville Rd
- 7126 Fernvale Springs Way
- 7110 Mapleside Ln
- 7320 Fernvale Rd
- 7523 Fernvale Springs Way
- 7507 Old Nashville Rd
- 7212 Rosemary Ct Unit 10
- 7216 Rosemary Ct Unit 12
- 7210 Rosemary Ct Unit C9
- 7208 Rosemary Ct
- 7501 Scarborough Place
- 7204 Rosemary Ct Unit 6
- 7224 Rosemary Ct Unit 16
- 7220 Rosemary Ct Unit D14
- 7218 Rosemary Ct Unit 13
- 7202 Rosemary Ct Unit 5
- 7503 Scarborough Place
- 7211 Rosemary Ct
- 7505 Scarborough Place
- 7209 Rosemary Ct
- 7215 Rosemary Ct
- 7213 Rosemary Ct
- 7203 Rosemary Ct Unit 2
- 7207 Rosemary Ct Unit 4
- 7205 Rosemary Ct
- 7201 Rosemary Ct