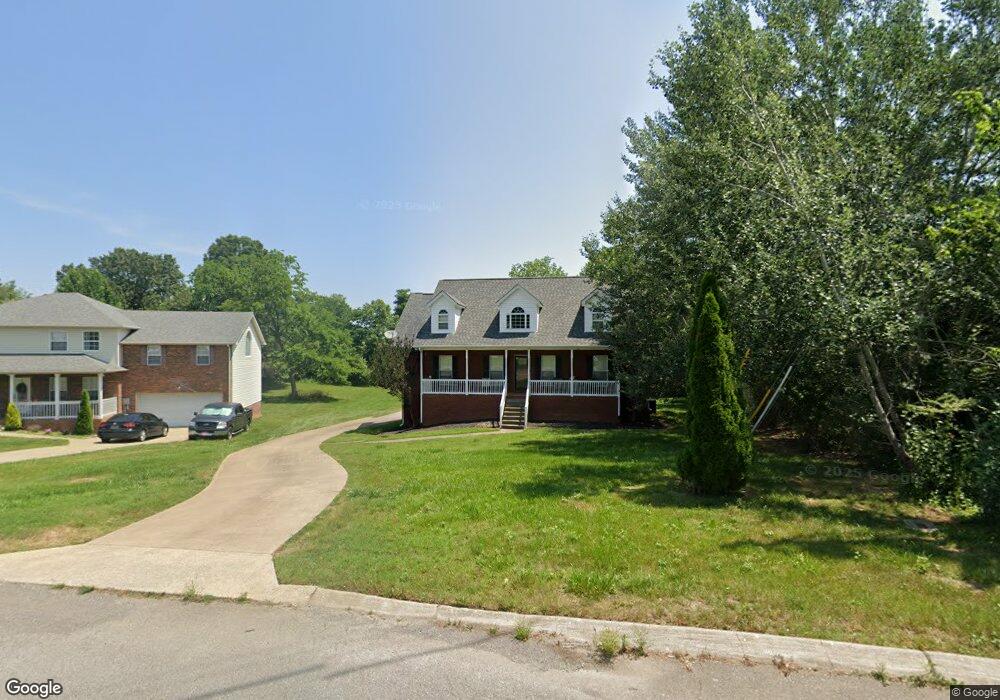
7219 Mary Susan Ln Fairview, TN 37062
Estimated Value: $559,000 - $627,000
--
Bed
3
Baths
2,410
Sq Ft
$243/Sq Ft
Est. Value
About This Home
This home is located at 7219 Mary Susan Ln, Fairview, TN 37062 and is currently estimated at $586,190, approximately $243 per square foot. 7219 Mary Susan Ln is a home located in Williamson County with nearby schools including Westwood Elementary School, Fairview Middle School, and Fairview High School.
Ownership History
Date
Name
Owned For
Owner Type
Purchase Details
Closed on
May 4, 2004
Sold by
Reigle Daniel H
Bought by
Regal Homes Inc
Current Estimated Value
Home Financials for this Owner
Home Financials are based on the most recent Mortgage that was taken out on this home.
Original Mortgage
$109,090
Outstanding Balance
$50,260
Interest Rate
5.36%
Mortgage Type
Seller Take Back
Estimated Equity
$535,930
Purchase Details
Closed on
Feb 17, 2004
Sold by
Reigle Daniel H
Bought by
Woodruff Dwight L
Home Financials for this Owner
Home Financials are based on the most recent Mortgage that was taken out on this home.
Original Mortgage
$135,120
Interest Rate
5.63%
Mortgage Type
Purchase Money Mortgage
Purchase Details
Closed on
Apr 7, 2003
Sold by
Cunningham Donald M and Cunningham Rosemary
Bought by
Reigle Daniel H
Home Financials for this Owner
Home Financials are based on the most recent Mortgage that was taken out on this home.
Original Mortgage
$150,000
Interest Rate
5.74%
Create a Home Valuation Report for This Property
The Home Valuation Report is an in-depth analysis detailing your home's value as well as a comparison with similar homes in the area
Home Values in the Area
Average Home Value in this Area
Purchase History
| Date | Buyer | Sale Price | Title Company |
|---|---|---|---|
| Regal Homes Inc | $109,090 | -- | |
| Woodruff Dwight L | $168,900 | -- | |
| Reigle Daniel H | $150,000 | Southland Title & Escrow Co |
Source: Public Records
Mortgage History
| Date | Status | Borrower | Loan Amount |
|---|---|---|---|
| Open | Regal Homes Inc | $109,090 | |
| Previous Owner | Woodruff Dwight L | $135,120 | |
| Previous Owner | Reigle Daniel H | $150,000 | |
| Closed | Woodruff Dwight L | $16,890 |
Source: Public Records
Tax History Compared to Growth
Tax History
| Year | Tax Paid | Tax Assessment Tax Assessment Total Assessment is a certain percentage of the fair market value that is determined by local assessors to be the total taxable value of land and additions on the property. | Land | Improvement |
|---|---|---|---|---|
| 2025 | $2,504 | $138,900 | $37,500 | $101,400 |
| 2024 | $2,504 | $90,825 | $18,750 | $72,075 |
| 2023 | $2,504 | $90,825 | $18,750 | $72,075 |
| 2022 | $2,504 | $90,825 | $18,750 | $72,075 |
| 2021 | $1,708 | $90,825 | $18,750 | $72,075 |
| 2020 | $1,384 | $62,325 | $7,500 | $54,825 |
| 2019 | $1,384 | $62,325 | $7,500 | $54,825 |
| 2018 | $1,340 | $62,325 | $7,500 | $54,825 |
| 2017 | $1,328 | $62,325 | $7,500 | $54,825 |
| 2016 | $1,309 | $62,325 | $7,500 | $54,825 |
| 2015 | -- | $59,475 | $7,500 | $51,975 |
| 2014 | -- | $59,475 | $7,500 | $51,975 |
Source: Public Records
Map
Nearby Homes
- 7509 Shoal Mill Point
- 7505 Shoal Mill Point
- 7532 Shoal Mill Point
- 7514 Shoal Mill Point
- 7332 Dutch River Cir
- 7344 Dutch River Cir
- 7341 Dutch River Cir
- 7456 Cox Pike
- 7323 Dutch River Cir E
- 7455 Cox Pike
- 7700 Cox Pike
- 0 Juniper Rd Unit RTC2925044
- 7327 Dutch River Cir E
- 7319 Dutch River Cir
- 7607 Wind River Ct
- 7225 Richvale Dr
- 7233 Richvale Dr
- 7406 Twill Heights Loop
- 7428 Twill Heights Loop
- Burgess Plan at Brush Creek
- 7221 Mary Susan Ln
- 7217 Mary Susan Ln
- 7223 Mary Susan Ln
- 7215 Mary Susan Ln
- 7314 Cold Harbor Ct
- 7218 Mary Susan Ln
- 7213 Mary Susan Ln
- 7402 Cold Harbor Ct
- 7220 Mary Susan Ln
- 7225 Mary Susan Ln
- 7222 Mary Susan Ln
- 7214 Mary Susan Ln
- 7312 Cold Harbor Ct
- 7211 Mary Susan Ln
- 7212 Mary Susan Ln
- 7403 Cold Harbor Ct
- 7310 Cold Harbor Ct
- 7224 Mary Susan Ln
- 7226 Mary Susan Ln
- 7209 Mary Susan Ln