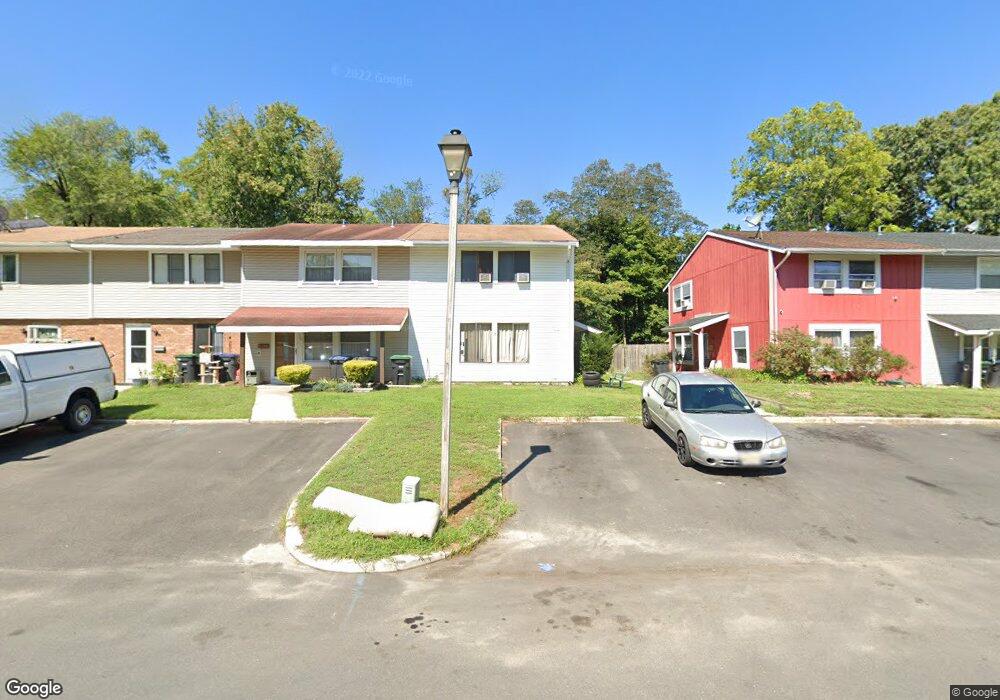
722 E Elm Ave Lindenwold, NJ 08021
Estimated Value: $135,000 - $219,000
3
Beds
2
Baths
1,400
Sq Ft
$131/Sq Ft
Est. Value
About This Home
This home is located at 722 E Elm Ave, Lindenwold, NJ 08021 and is currently estimated at $183,483, approximately $131 per square foot. 722 E Elm Ave is a home located in Camden County with nearby schools including Lindenwold High School, South Jersey Sudbury School, and Trinity Preparatory School Inc..
Ownership History
Date
Name
Owned For
Owner Type
Purchase Details
Closed on
Mar 21, 2022
Sold by
Kumar and Prem
Bought by
Rkp Re Group Llc
Current Estimated Value
Purchase Details
Closed on
Apr 19, 2021
Sold by
Martorano Nicholas Anthony and Martorano Maria Dorando
Bought by
Kumar Rakesh and Lata Prem
Home Financials for this Owner
Home Financials are based on the most recent Mortgage that was taken out on this home.
Original Mortgage
$10,000
Interest Rate
3%
Mortgage Type
Purchase Money Mortgage
Purchase Details
Closed on
Feb 8, 2005
Sold by
Risdorfer Robert
Bought by
Ty Brown Re Llc
Purchase Details
Closed on
Aug 6, 2003
Sold by
Gmac Mortgage Corp
Bought by
Secr Housing And Urban Dev
Purchase Details
Closed on
Oct 30, 2000
Sold by
Maneen Richard S
Bought by
Newlin Alberta C
Home Financials for this Owner
Home Financials are based on the most recent Mortgage that was taken out on this home.
Original Mortgage
$54,200
Interest Rate
7.81%
Purchase Details
Closed on
May 16, 1994
Sold by
First Fidelity Bk
Bought by
Maneen Richard and Maneen Maria
Create a Home Valuation Report for This Property
The Home Valuation Report is an in-depth analysis detailing your home's value as well as a comparison with similar homes in the area
Home Values in the Area
Average Home Value in this Area
Purchase History
| Date | Buyer | Sale Price | Title Company |
|---|---|---|---|
| Rkp Re Group Llc | -- | Kosylo John D | |
| Kumar Rakesh | $80,000 | National Integrity Llc | |
| Ty Brown Re Llc | $75,000 | -- | |
| Secr Housing And Urban Dev | -- | -- | |
| Newlin Alberta C | $54,700 | -- | |
| Maneen Richard | $35,000 | -- |
Source: Public Records
Mortgage History
| Date | Status | Borrower | Loan Amount |
|---|---|---|---|
| Previous Owner | Kumar Rakesh | $10,000 | |
| Previous Owner | Newlin Alberta C | $54,200 |
Source: Public Records
Tax History
| Year | Tax Paid | Tax Assessment Tax Assessment Total Assessment is a certain percentage of the fair market value that is determined by local assessors to be the total taxable value of land and additions on the property. | Land | Improvement |
|---|---|---|---|---|
| 2025 | $3,654 | $73,500 | $25,800 | $47,700 |
| 2024 | $3,654 | $73,500 | $25,800 | $47,700 |
| 2023 | $3,654 | $73,500 | $25,800 | $47,700 |
| 2022 | $3,651 | $73,500 | $25,800 | $47,700 |
| 2021 | $3,751 | $73,500 | $25,800 | $47,700 |
| 2020 | $3,729 | $73,500 | $25,800 | $47,700 |
| 2019 | $3,762 | $73,500 | $25,800 | $47,700 |
| 2018 | $3,753 | $73,500 | $25,800 | $47,700 |
| 2017 | $3,640 | $73,500 | $25,800 | $47,700 |
| 2016 | $3,559 | $73,500 | $25,800 | $47,700 |
| 2015 | $3,409 | $73,500 | $25,800 | $47,700 |
| 2014 | $3,260 | $73,500 | $25,800 | $47,700 |
Source: Public Records
Map
Nearby Homes
- 725 E Linden Ave
- 827 E Elm Ave
- 805 Myrtle Ave
- 450 Hawthorne St
- 320 Roosevelt Ave
- 434 E Maple Ave
- 0 Berlin Rd N
- 409 Cedar Ave
- 318 E Elm Ave
- 69 Holly Rd
- 220 Myrtle Ave
- 116 Laureba Ave
- 304 Spruce Ave
- 36 E Park Ave
- 124 Stratford Ave
- 18 Henry Rd
- 961 - E Gibbsboro Rd
- 27 Sidney Ln
- 813 N White Horse Pike
- 1256 Kirkwood-Gibbsboro R
Your Personal Tour Guide
Ask me questions while you tour the home.