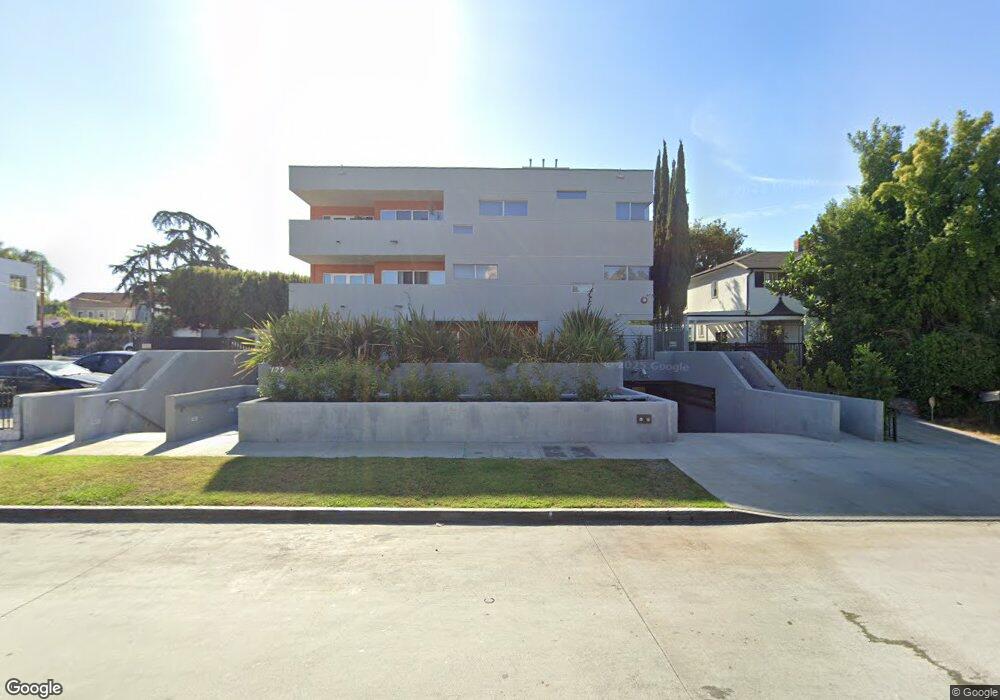
722 S Windsor Blvd Unit 301 Los Angeles, CA 90005
Miracle Mile NeighborhoodEstimated Value: $971,000 - $1,323,000
3
Beds
4
Baths
2,140
Sq Ft
$550/Sq Ft
Est. Value
About This Home
This home is located at 722 S Windsor Blvd Unit 301, Los Angeles, CA 90005 and is currently estimated at $1,176,858, approximately $549 per square foot. 722 S Windsor Blvd Unit 301 is a home located in Los Angeles County with nearby schools including Wilshire Park Elementary School, John Burroughs Middle School, and Los Angeles Senior High School.
Ownership History
Date
Name
Owned For
Owner Type
Purchase Details
Closed on
Dec 8, 2008
Sold by
Lee Andy
Bought by
Lee Cathline
Current Estimated Value
Purchase Details
Closed on
Sep 17, 2008
Sold by
Bank Of New York
Bought by
Lee Cathline
Home Financials for this Owner
Home Financials are based on the most recent Mortgage that was taken out on this home.
Original Mortgage
$417,000
Interest Rate
5.14%
Mortgage Type
Purchase Money Mortgage
Purchase Details
Closed on
Jul 7, 2008
Sold by
Lee Young Shun
Bought by
The Bank Of New York and Cwalt Inc Alternative Loan Trust 2006-Oc
Purchase Details
Closed on
Oct 30, 2006
Sold by
Soonlee Llc
Bought by
Lee Young Shun
Home Financials for this Owner
Home Financials are based on the most recent Mortgage that was taken out on this home.
Original Mortgage
$749,250
Interest Rate
7.37%
Mortgage Type
Purchase Money Mortgage
Create a Home Valuation Report for This Property
The Home Valuation Report is an in-depth analysis detailing your home's value as well as a comparison with similar homes in the area
Home Values in the Area
Average Home Value in this Area
Purchase History
| Date | Buyer | Sale Price | Title Company |
|---|---|---|---|
| Lee Cathline | -- | Landsafe Title | |
| Lee Cathline | $640,000 | Landsafe Title | |
| The Bank Of New York | $664,700 | Landsafe Title | |
| Lee Young Shun | $999,000 | None Available |
Source: Public Records
Mortgage History
| Date | Status | Borrower | Loan Amount |
|---|---|---|---|
| Previous Owner | Lee Cathline | $417,000 | |
| Previous Owner | Lee Young Shun | $749,250 |
Source: Public Records
Tax History Compared to Growth
Tax History
| Year | Tax Paid | Tax Assessment Tax Assessment Total Assessment is a certain percentage of the fair market value that is determined by local assessors to be the total taxable value of land and additions on the property. | Land | Improvement |
|---|---|---|---|---|
| 2025 | $9,854 | $824,151 | $344,338 | $479,813 |
| 2024 | $9,854 | $807,992 | $337,587 | $470,405 |
| 2023 | $9,665 | $792,150 | $330,968 | $461,182 |
| 2022 | $9,217 | $776,619 | $324,479 | $452,140 |
| 2021 | $9,093 | $761,392 | $318,117 | $443,275 |
| 2019 | $8,818 | $738,811 | $308,683 | $430,128 |
| 2018 | $8,772 | $724,326 | $302,631 | $421,695 |
| 2016 | $8,375 | $696,202 | $290,881 | $405,321 |
| 2015 | $8,252 | $685,745 | $286,512 | $399,233 |
| 2014 | $8,280 | $672,313 | $280,900 | $391,413 |
Source: Public Records
Map
Nearby Homes
- 728 S Windsor Blvd
- 701 Lorraine Blvd
- 707 Crenshaw Blvd
- 727 Crenshaw Blvd
- 821 Lorraine Blvd
- 601 S Windsor Blvd
- 837 S Windsor Blvd Unit 3
- 801 S Plymouth Blvd Unit 204
- 676 S Bronson Ave
- 832 S Plymouth Blvd
- 800 S Bronson Ave
- 851 Crenshaw Blvd
- 691 S Norton Ave
- 695 S Norton Ave
- 602 S Lucerne Blvd
- 4100 Wilshire Blvd Unit 303
- 4085 W 7th St
- 738 S Norton Ave
- 4327 Francis Ave
- 632 S Arden Blvd
- 722 S Windsor Blvd
- 722 S Windsor Blvd Unit 201
- 722 S Windsor Blvd Unit 202
- 722 S Windsor Blvd Unit 102
- 722 S Windsor Blvd Unit 302
- 703 Lorraine Blvd
- 703 Lorraine Blvd Unit 703
- 703 Lorraine Blvd Unit 703. 5
- 703 Lorraine Blvd Unit 703.50
- 701 Lorraine Blvd Unit 703 .50
- 701 Lorraine Blvd Unit 703
- 701 Lorraine Blvd Unit 4
- 736 S Windsor Blvd
- 677 Lorraine Blvd
- 703 1/2 Lorraine Blvd Unit 703
- 703 1/2 Lorraine Blvd
- 703 1/2 Lorraine Blvd Unit 703 1/2
- 709 Lorraine Blvd
- 701 1/2 Lorraine Blvd Unit 703
- 701 1/2 Lorraine Blvd