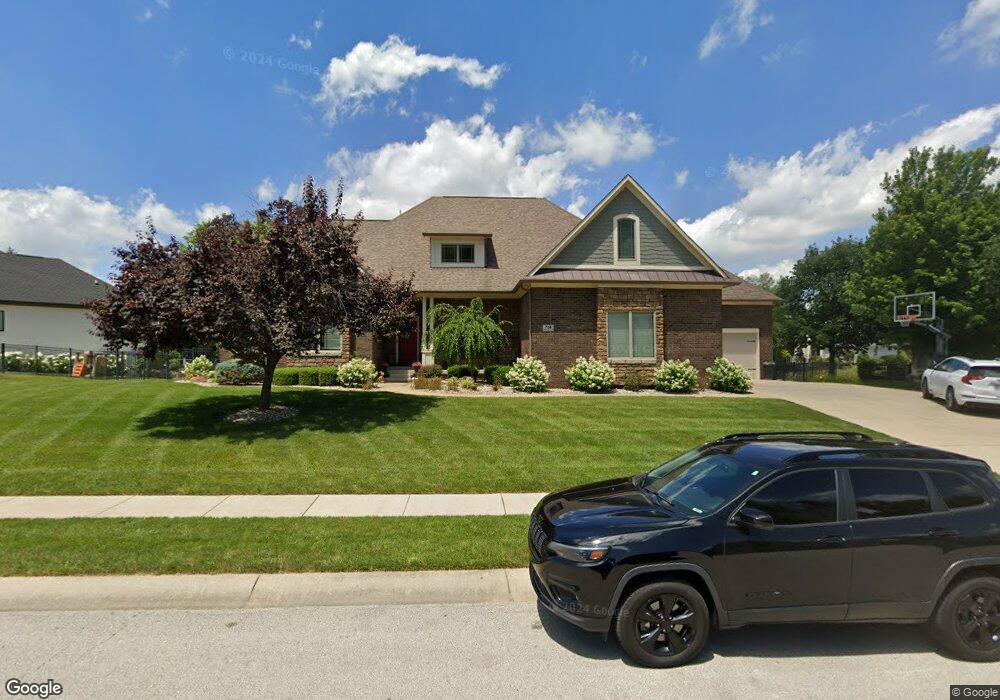
722 Willow Pointe South Dr Plainfield, IN 46168
Estimated Value: $607,000 - $677,000
3
Beds
4
Baths
2,726
Sq Ft
$234/Sq Ft
Est. Value
About This Home
This home is located at 722 Willow Pointe South Dr, Plainfield, IN 46168 and is currently estimated at $638,118, approximately $234 per square foot. 722 Willow Pointe South Dr is a home located in Hendricks County with nearby schools including Central Elementary School, Plainfield Community Middle School, and Plainfield High School.
Ownership History
Date
Name
Owned For
Owner Type
Purchase Details
Closed on
Dec 10, 2021
Sold by
Ahmad and Monawar
Bought by
Kiger Kristopher S and Kiger Jennifer N
Current Estimated Value
Home Financials for this Owner
Home Financials are based on the most recent Mortgage that was taken out on this home.
Original Mortgage
$513,000
Outstanding Balance
$470,998
Interest Rate
2.98%
Mortgage Type
New Conventional
Estimated Equity
$167,120
Purchase Details
Closed on
Nov 29, 2006
Sold by
Ahmad Tipu
Bought by
Ahmad Tipu and Sultan Monawar
Home Financials for this Owner
Home Financials are based on the most recent Mortgage that was taken out on this home.
Original Mortgage
$348,000
Interest Rate
6.47%
Mortgage Type
New Conventional
Create a Home Valuation Report for This Property
The Home Valuation Report is an in-depth analysis detailing your home's value as well as a comparison with similar homes in the area
Home Values in the Area
Average Home Value in this Area
Purchase History
| Date | Buyer | Sale Price | Title Company |
|---|---|---|---|
| Kiger Kristopher S | $540,000 | Drake Andrew R | |
| Ahmad Tipu | -- | None Available | |
| Ahmad Tipu | -- | None Available |
Source: Public Records
Mortgage History
| Date | Status | Borrower | Loan Amount |
|---|---|---|---|
| Open | Kiger Kristopher S | $513,000 | |
| Previous Owner | Ahmad Tipu | $348,000 |
Source: Public Records
Tax History Compared to Growth
Tax History
| Year | Tax Paid | Tax Assessment Tax Assessment Total Assessment is a certain percentage of the fair market value that is determined by local assessors to be the total taxable value of land and additions on the property. | Land | Improvement |
|---|---|---|---|---|
| 2024 | $5,759 | $575,900 | $44,700 | $531,200 |
| 2023 | $5,483 | $548,300 | $42,600 | $505,700 |
| 2022 | $5,392 | $539,200 | $41,800 | $497,400 |
| 2021 | $4,943 | $494,300 | $41,800 | $452,500 |
| 2020 | $4,997 | $499,700 | $41,800 | $457,900 |
| 2019 | $4,700 | $470,000 | $39,700 | $430,300 |
| 2018 | $4,631 | $463,100 | $39,700 | $423,400 |
| 2017 | $4,440 | $444,000 | $40,000 | $404,000 |
| 2016 | $4,323 | $432,300 | $40,000 | $392,300 |
| 2014 | $3,999 | $399,900 | $36,600 | $363,300 |
Source: Public Records
Map
Nearby Homes
- 731 Andrews Blvd
- 710 Hanna St
- 269 Andrews Boulevard East Dr
- 251 Andrews Blvd
- 5733 Yorktown Rd
- 5875 Farwell Ave
- 4181 Baranga Dr
- 5883 Farwell Ave
- Foxhall Plan at Saratoga Village - Frontload
- Edinburgh Plan at Saratoga Village - Frontload
- Meridian III Plan at Saratoga Village - Rearload
- Madison Plan at Saratoga Village - Rearload
- Talbott II Plan at Saratoga Village - Rearload
- 215 Andrews Boulevard East Dr
- 3610 Homestead Place
- 5581 E County Road 350 S
- 5716 Kensington Blvd
- 1042 W Main St
- 325 N Center St
- 4088 Del Mar Ln
- 726 Willow Pointe South Dr
- 726 Willow Pointe South Dr
- 722 Willow Pointe Dr S
- 727 Willow Pointe Dr S
- LOT 8 Willow Pointe Dr S
- 718 Willow Pointe Dr S
- 723 Willow Pointe Dr S
- 731 Willow Pointe Dr S
- 718 Willow Pointe South Dr
- 727 Willow Pointe South Dr
- 731 Willow Pointe South Dr
- 730 Willow Pointe South Dr
- 713 Willow Pointe North Dr
- 714 Willow Pointe South Dr
- 735 Willow Pointe South Dr
- 735 Willow Pointe South Dr
- 717 Willow Pointe North Dr
- 739 Willow Pointe Dr S
- 709 Willow Pointe North Dr
- 709 Willow Pointe North Dr