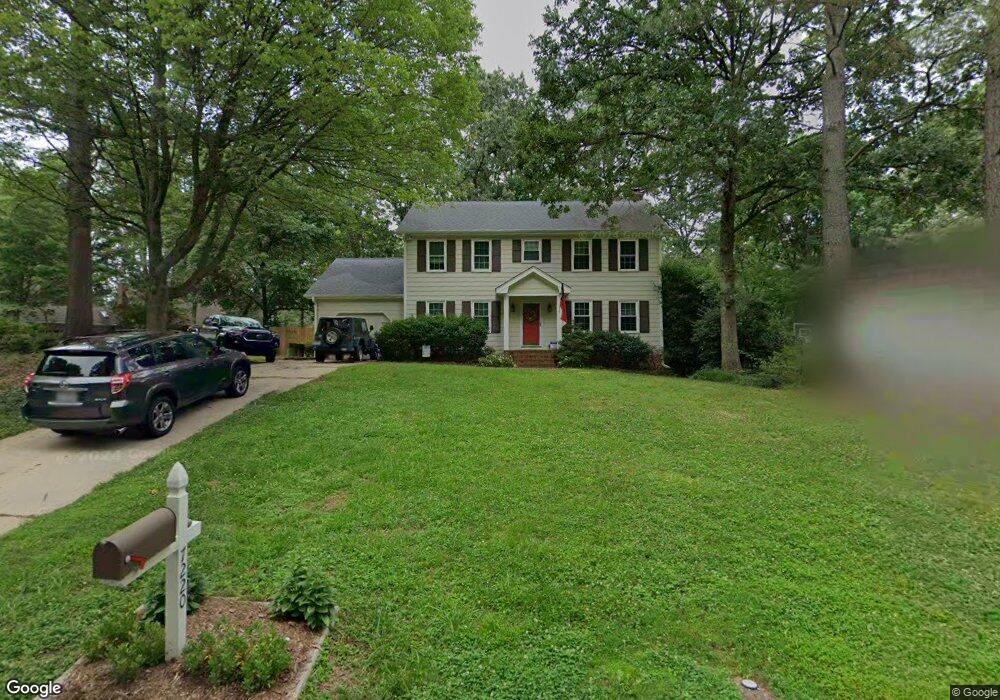
7220 St Ledger Dr Raleigh, NC 27613
Estimated Value: $522,000 - $550,929
4
Beds
3
Baths
2,038
Sq Ft
$261/Sq Ft
Est. Value
About This Home
This home is located at 7220 St Ledger Dr, Raleigh, NC 27613 and is currently estimated at $532,232, approximately $261 per square foot. 7220 St Ledger Dr is a home located in Wake County with nearby schools including Jeffreys Grove Elementary School, Carroll Middle, and Sanderson High School.
Ownership History
Date
Name
Owned For
Owner Type
Purchase Details
Closed on
Oct 25, 2012
Sold by
Mcphatter Thomas J and Mcphatter Katherine C
Bought by
Rebenat Thomas and Rebenat Danielle
Current Estimated Value
Home Financials for this Owner
Home Financials are based on the most recent Mortgage that was taken out on this home.
Original Mortgage
$218,405
Outstanding Balance
$152,414
Interest Rate
3.6%
Mortgage Type
New Conventional
Estimated Equity
$379,818
Purchase Details
Closed on
Sep 19, 2003
Sold by
Schlimme John and Schlimme Connie Jean
Bought by
Mcphatter Thomas J and Mcphatter Katherine C
Home Financials for this Owner
Home Financials are based on the most recent Mortgage that was taken out on this home.
Original Mortgage
$193,000
Interest Rate
7.75%
Mortgage Type
Purchase Money Mortgage
Purchase Details
Closed on
Mar 28, 2003
Sold by
Gibson Raymond Blake and Gibson Rochelle Sasha
Bought by
Schlimme John
Purchase Details
Closed on
Jul 24, 2001
Sold by
Gibson Rochelle Sasha
Bought by
Gibson Raymond Blake
Create a Home Valuation Report for This Property
The Home Valuation Report is an in-depth analysis detailing your home's value as well as a comparison with similar homes in the area
Home Values in the Area
Average Home Value in this Area
Purchase History
| Date | Buyer | Sale Price | Title Company |
|---|---|---|---|
| Rebenat Thomas | $230,000 | None Available | |
| Mcphatter Thomas J | $193,000 | -- | |
| Schlimme John | $131,000 | -- | |
| Gibson Raymond Blake | -- | -- |
Source: Public Records
Mortgage History
| Date | Status | Borrower | Loan Amount |
|---|---|---|---|
| Open | Rebenat Thomas | $218,405 | |
| Previous Owner | Mcphatter Thomas J | $193,000 |
Source: Public Records
Tax History Compared to Growth
Tax History
| Year | Tax Paid | Tax Assessment Tax Assessment Total Assessment is a certain percentage of the fair market value that is determined by local assessors to be the total taxable value of land and additions on the property. | Land | Improvement |
|---|---|---|---|---|
| 2025 | $4,510 | $514,803 | $200,000 | $314,803 |
| 2024 | $4,491 | $514,803 | $200,000 | $314,803 |
| 2023 | $3,071 | $279,865 | $115,000 | $164,865 |
| 2022 | $2,854 | $279,865 | $115,000 | $164,865 |
| 2021 | $2,743 | $279,865 | $115,000 | $164,865 |
| 2020 | $2,693 | $279,865 | $115,000 | $164,865 |
| 2019 | $2,702 | $231,383 | $100,000 | $131,383 |
| 2018 | $2,548 | $231,383 | $100,000 | $131,383 |
| 2017 | $2,427 | $231,383 | $100,000 | $131,383 |
| 2016 | $2,377 | $231,383 | $100,000 | $131,383 |
| 2015 | $2,181 | $208,682 | $78,000 | $130,682 |
| 2014 | -- | $208,682 | $78,000 | $130,682 |
Source: Public Records
Map
Nearby Homes
- 7401 Ray Rd
- 6924 Three Bridges Cir
- 2609 Cobworth Ct
- 7741 Wilderness Rd
- 7601 Valview St
- 2508 Village Grove Rd
- 2610 Sawmill Rd
- 8913 Taymouth Ct
- 7713 Stonehenge Farm Ln
- 8920 Taymouth Ct
- 7628 Valview St
- 2428 Havershire Dr
- 2805 Dunkirk Dr
- 8100 Laurel Mountain Rd
- 204 Autumn Chase Dr Unit 204
- 104 Oak Hollow Ct Unit 104
- 401 Oak Hollow Ct Unit 401
- 202 Oak Hollow Ct
- 6928 Leesville Rd
- 6502 Brecken Pines Ct
- 7220 Saint Ledger Dr
- 7216 Saint Ledger Dr
- 7216 St Ledger Dr
- 2817 Pidgeon Hill Rd
- 2824 Pidgeon Hill Rd
- 7212 Saint Ledger Dr
- 2820 Pidgeon Hill Rd
- 7217 St Ledger Dr
- 7212 St Ledger Dr
- 7213 Saint Ledger Dr
- 7217 Saint Ledger Dr
- 7209 Saint Ledger Dr
- 2813 Pidgeon Hill Rd
- 2816 Pidgeon Hill Rd
- 7301 Saint Ledger Dr
- 7304 Saint Ledger Dr
- 2804 Steeplechase Ct
- 2800 Steeplechase Ct
- 7205 St Ledger Dr
- 7208 Saint Ledger Dr