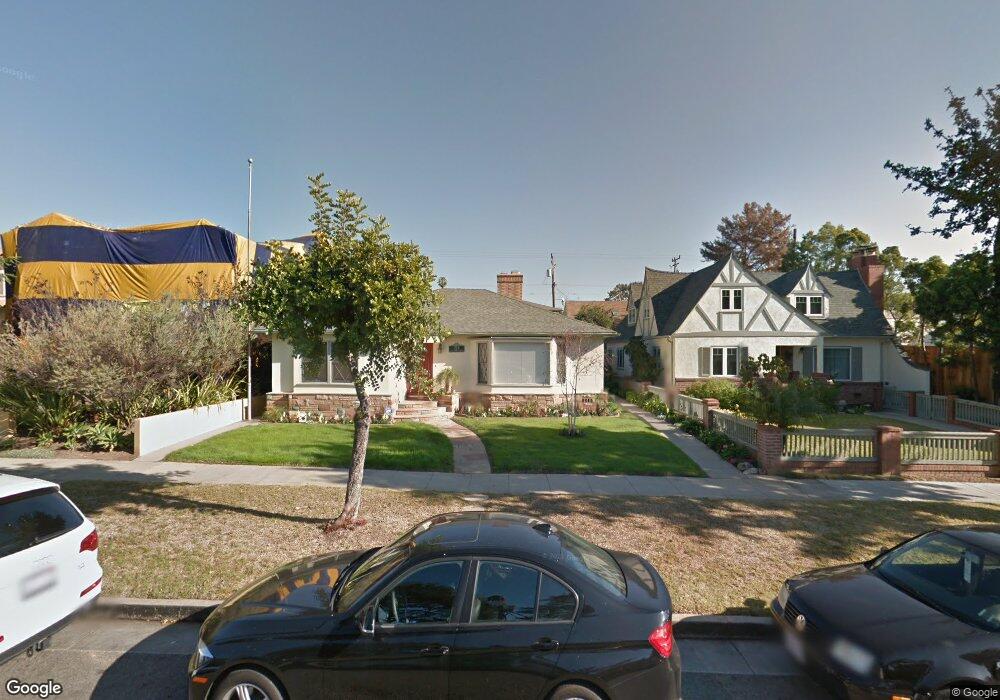
723 12th St Santa Monica, CA 90402
North of Montana NeighborhoodEstimated Value: $2,394,000 - $4,123,783
6
Beds
4
Baths
3,306
Sq Ft
$1,061/Sq Ft
Est. Value
About This Home
This home is located at 723 12th St, Santa Monica, CA 90402 and is currently estimated at $3,507,946, approximately $1,061 per square foot. 723 12th St is a home located in Los Angeles County with nearby schools including Roosevelt Elementary School, Lincoln Middle School, and Santa Monica High School.
Ownership History
Date
Name
Owned For
Owner Type
Purchase Details
Closed on
Mar 31, 2006
Sold by
Sevy Robert L
Bought by
Sevy Robert L
Current Estimated Value
Home Financials for this Owner
Home Financials are based on the most recent Mortgage that was taken out on this home.
Original Mortgage
$600,000
Outstanding Balance
$349,950
Interest Rate
6.62%
Mortgage Type
Purchase Money Mortgage
Estimated Equity
$3,157,996
Purchase Details
Closed on
Sep 8, 2005
Sold by
Sevy Robert L and Sevy Jacqueline A
Bought by
Sevy Robert L
Purchase Details
Closed on
Jul 18, 1997
Sold by
Kosters Marvin H and The Marvin H Kosters Trust
Bought by
Sevy Robert L and Sevy Jacqueline A
Home Financials for this Owner
Home Financials are based on the most recent Mortgage that was taken out on this home.
Original Mortgage
$562,500
Interest Rate
7.43%
Purchase Details
Closed on
Oct 12, 1995
Sold by
Kosters Marvin H and Kosters Bonnie M
Bought by
Kosters Marvin H and Kosters Bonnie M
Create a Home Valuation Report for This Property
The Home Valuation Report is an in-depth analysis detailing your home's value as well as a comparison with similar homes in the area
Home Values in the Area
Average Home Value in this Area
Purchase History
| Date | Buyer | Sale Price | Title Company |
|---|---|---|---|
| Sevy Robert L | -- | Stewart Title Of Ca Inc | |
| Sevy Robert L | -- | -- | |
| Sevy Robert L | $750,000 | Continental Lawyers Title Co | |
| Kosters Marvin H | -- | -- |
Source: Public Records
Mortgage History
| Date | Status | Borrower | Loan Amount |
|---|---|---|---|
| Open | Sevy Robert L | $600,000 | |
| Closed | Sevy Robert L | $562,500 |
Source: Public Records
Tax History Compared to Growth
Tax History
| Year | Tax Paid | Tax Assessment Tax Assessment Total Assessment is a certain percentage of the fair market value that is determined by local assessors to be the total taxable value of land and additions on the property. | Land | Improvement |
|---|---|---|---|---|
| 2025 | $14,823 | $1,197,554 | $750,471 | $447,083 |
| 2024 | $14,823 | $1,174,073 | $735,756 | $438,317 |
| 2023 | $14,586 | $1,151,053 | $721,330 | $429,723 |
| 2022 | $14,393 | $1,128,485 | $707,187 | $421,298 |
| 2021 | $13,933 | $1,106,359 | $693,321 | $413,038 |
| 2020 | $13,835 | $1,095,015 | $686,212 | $408,803 |
| 2019 | $13,689 | $1,073,545 | $672,757 | $400,788 |
| 2018 | $12,829 | $1,052,496 | $659,566 | $392,930 |
| 2016 | $12,333 | $1,011,628 | $633,955 | $377,673 |
| 2015 | $12,170 | $996,433 | $624,433 | $372,000 |
| 2014 | $12,025 | $976,916 | $612,202 | $364,714 |
Source: Public Records
Map
Nearby Homes
- 827 12th St
- 723 14th St
- 728 11th St
- 837 11th St Unit 7
- 858 12th St Unit 4
- 831 14th St Unit 2
- 817 10th St Unit 104
- 548 15th St
- 937 12th St Unit 308
- 618 10th St
- 933 11th St Unit 21
- 713 9th St Unit 3
- 943 12th St Unit 7
- 925 14th St Unit 20
- 852 10th St Unit 1
- 443 Euclid St
- 1325 Washington Ave Unit C
- 1012 1/2 Euclid St
- 830 17th St Unit 2
- 838 17th St Unit 105
- 723 12th St Unit A
- 717 12th St
- 727 12th St
- 711 12th St
- 728 Euclid St Unit f
- 728 Euclid St Unit A
- 728 Euclid St Unit E
- 728 Euclid St Unit D
- 728 Euclid St
- 728 Euclid St Unit A & B
- 728 Euclid St
- 707 12th St
- 724 Euclid St
- 718 Euclid St
- 714 Euclid St
- 703 12th St
- 708 Euclid St
- 734 12th St
- 724 12th St
- 718 12th St