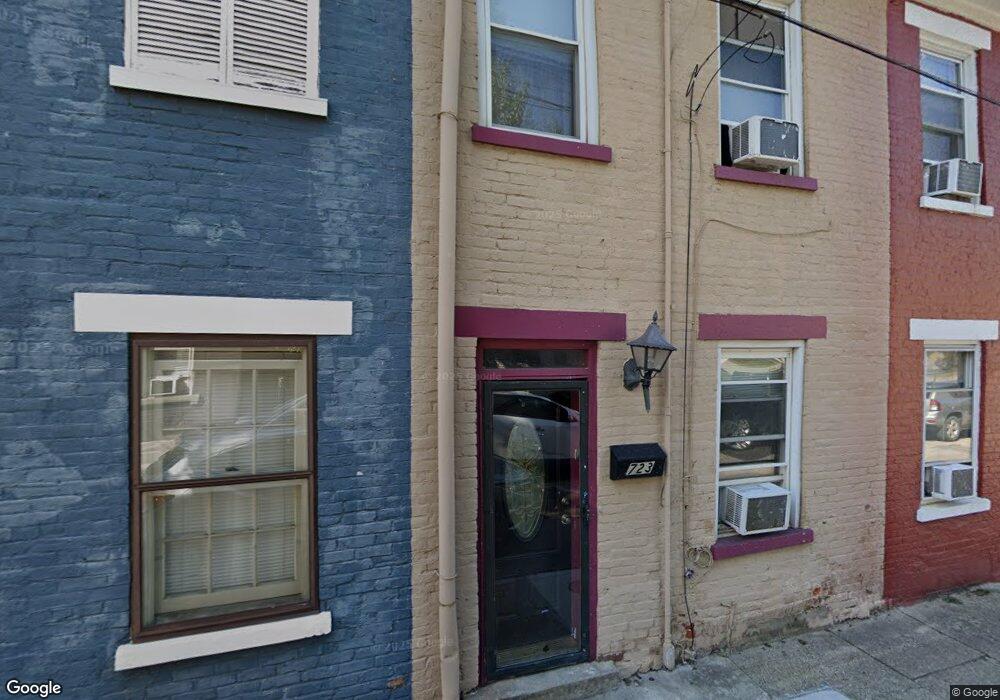
723 Craig St Covington, KY 41011
Downtown Covington NeighborhoodEstimated Value: $99,000 - $262,000
2
Beds
1
Bath
1,159
Sq Ft
$159/Sq Ft
Est. Value
About This Home
This home is located at 723 Craig St, Covington, KY 41011 and is currently estimated at $184,319, approximately $159 per square foot. 723 Craig St is a home located in Kenton County with nearby schools including Holmes High School, Prince of Peace School, and Saint Augustine Catholic School.
Ownership History
Date
Name
Owned For
Owner Type
Purchase Details
Closed on
May 30, 2013
Sold by
Rayne Sandra
Bought by
Rayne Sandra L
Current Estimated Value
Purchase Details
Closed on
Mar 16, 2012
Sold by
Fannie Mae
Bought by
Rayne Sandra
Purchase Details
Closed on
Nov 7, 2011
Sold by
Buchholz Mindy H and Buchholz Richard
Bought by
Federal National Mortgage Association
Purchase Details
Closed on
Jul 27, 2001
Sold by
Gaible Michael
Bought by
Buchholz Mindy L
Purchase Details
Closed on
Dec 13, 1996
Sold by
Spivey Charles
Bought by
Gaible Diane T
Create a Home Valuation Report for This Property
The Home Valuation Report is an in-depth analysis detailing your home's value as well as a comparison with similar homes in the area
Home Values in the Area
Average Home Value in this Area
Purchase History
| Date | Buyer | Sale Price | Title Company |
|---|---|---|---|
| Rayne Sandra L | -- | None Available | |
| Rayne Sandra | $18,500 | None Available | |
| Federal National Mortgage Association | $26,667 | None Available | |
| Buchholz Mindy L | $18,500 | -- | |
| Gaible Diane T | $18,000 | -- |
Source: Public Records
Tax History
| Year | Tax Paid | Tax Assessment Tax Assessment Total Assessment is a certain percentage of the fair market value that is determined by local assessors to be the total taxable value of land and additions on the property. | Land | Improvement |
|---|---|---|---|---|
| 2025 | $795 | $60,000 | $5,000 | $55,000 |
| 2024 | $789 | $60,000 | $5,000 | $55,000 |
| 2023 | $799 | $60,000 | $5,000 | $55,000 |
| 2022 | $852 | $60,000 | $5,000 | $55,000 |
| 2021 | $523 | $30,000 | $5,000 | $25,000 |
| 2020 | $521 | $30,000 | $5,000 | $25,000 |
| 2019 | $526 | $30,000 | $5,000 | $25,000 |
| 2018 | $536 | $30,000 | $5,000 | $25,000 |
| 2017 | $364 | $18,500 | $5,000 | $13,500 |
| 2015 | $480 | $18,500 | $5,000 | $13,500 |
| 2014 | $407 | $18,500 | $5,000 | $13,500 |
Source: Public Records
Map
Nearby Homes
- 138 W Pike St
- 346 W 9th St
- 328 W 6th St
- 501 Johnson St
- 1025 Banklick St
- 130 W 4th St
- 128 W 4th St
- 126 W 4th St
- 124 W 4th St
- 515 W 9th St
- 1212-1234 W Pike St
- 656 W Pike St
- 664 W Pike St
- 328 W Martin Luther King Junior Blvd
- 112 E 5th St
- 114 E 5th St
- 634 Greenup St
- 1217 Russell St
- 1220 Holman St
- 1219 Russell St
Your Personal Tour Guide
Ask me questions while you tour the home.