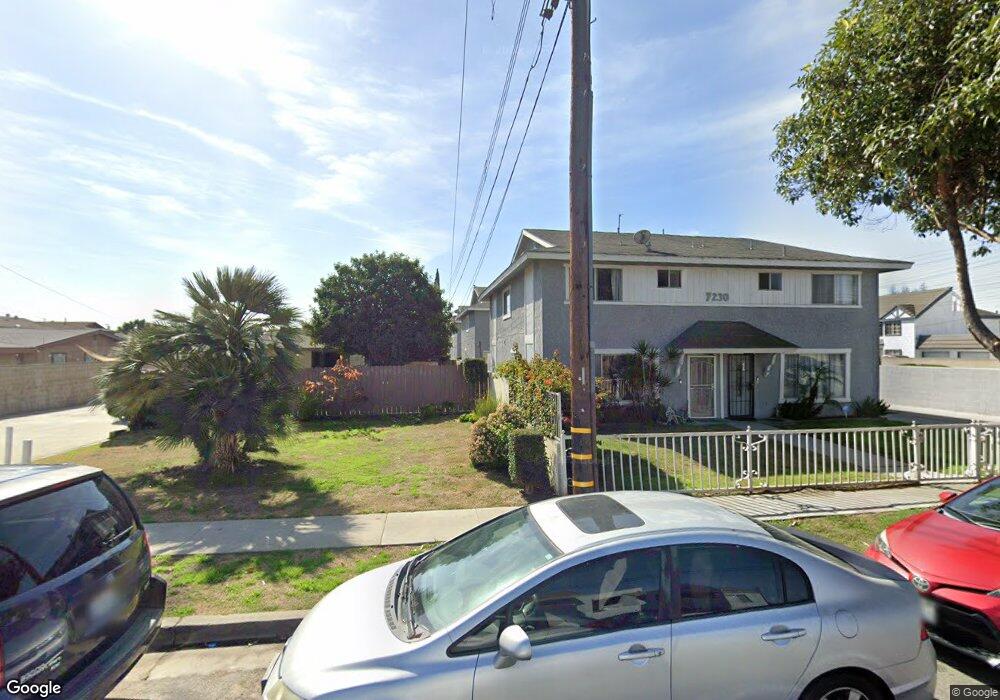
7230 Richfield St Unit 9 Paramount, CA 90723
Estimated Value: $426,000 - $487,000
3
Beds
2
Baths
1,129
Sq Ft
$412/Sq Ft
Est. Value
About This Home
This home is located at 7230 Richfield St Unit 9, Paramount, CA 90723 and is currently estimated at $464,716, approximately $411 per square foot. 7230 Richfield St Unit 9 is a home located in Los Angeles County with nearby schools including Howard Tanner School, Frank J. Zamboni School, and Paramount High School.
Ownership History
Date
Name
Owned For
Owner Type
Purchase Details
Closed on
Aug 26, 2011
Sold by
Ahumada Martha Cecilia and Caballero Martha Cecilia
Bought by
Caballero Gilberto Alejandro
Current Estimated Value
Purchase Details
Closed on
Feb 4, 2002
Sold by
Hud
Bought by
Caballero Martha Cecilia
Home Financials for this Owner
Home Financials are based on the most recent Mortgage that was taken out on this home.
Original Mortgage
$88,000
Interest Rate
6.84%
Purchase Details
Closed on
Mar 1, 2001
Sold by
Wells Fargo Home Mtg Inc
Bought by
Hud
Purchase Details
Closed on
Dec 14, 2000
Sold by
Gutierrez Oscar and Gutierrez Gustavo
Bought by
Wells Fargo Home Mtg Inc and Norwest Mtg Inc
Purchase Details
Closed on
Feb 12, 1998
Sold by
Gutierrez Gustavo and Gutierrez Indaiecio
Bought by
Gutierrez Oscar
Create a Home Valuation Report for This Property
The Home Valuation Report is an in-depth analysis detailing your home's value as well as a comparison with similar homes in the area
Home Values in the Area
Average Home Value in this Area
Purchase History
We collect this data history from publicly available records. To have your information removed, we recommend requesting removal directly through your county’s website.
| Date | Buyer | Sale Price | Title Company |
|---|---|---|---|
| Caballero Gilberto Alejandro | -- | None Available | |
| Caballero Martha Cecilia | $110,000 | Commerce Title | |
| Hud | -- | First American Title Ins Co | |
| Wells Fargo Home Mtg Inc | $125,196 | First American Title Ins Co | |
| Gutierrez Oscar | -- | -- |
Source: Public Records
Mortgage History
We collect this data history from publicly available records. To have your information removed, we recommend requesting removal directly through your county’s website.
| Date | Status | Borrower | Loan Amount |
|---|---|---|---|
| Previous Owner | Caballero Martha Cecilia | $88,000 |
Source: Public Records
Tax History
| Year | Tax Paid | Tax Assessment Tax Assessment Total Assessment is a certain percentage of the fair market value that is determined by local assessors to be the total taxable value of land and additions on the property. | Land | Improvement |
|---|---|---|---|---|
| 2025 | $2,296 | $143,176 | $42,698 | $100,478 |
| 2024 | $2,166 | $140,369 | $41,861 | $98,508 |
| 2023 | $2,129 | $137,618 | $41,041 | $96,577 |
| 2022 | $2,073 | $134,921 | $40,237 | $94,684 |
| 2021 | $2,024 | $132,277 | $39,449 | $92,828 |
| 2019 | $2,064 | $128,356 | $38,280 | $90,076 |
| 2018 | $1,917 | $125,840 | $37,530 | $88,310 |
| 2016 | $1,726 | $120,956 | $36,074 | $84,882 |
| 2015 | $1,637 | $119,140 | $35,533 | $83,607 |
| 2014 | $1,676 | $116,807 | $34,837 | $81,970 |
Source: Public Records
Map
Nearby Homes
- 7240 Richfield St
- 7315 Exeter St Unit 6
- 7258 Exeter St Unit 6
- 7221 Petrol St Unit 53
- 7032 San Vincente St
- 7047 San Marcus St
- 7101 Rosecrans Ave Unit 84
- 7032 Somerset Blvd
- 15137 Gundry Ave Unit F
- 6656 Rosecrans Ave Unit N-10
- 6626 San Miguel St
- 6610 San Carlos St
- 6552 San Juan St
- 6556 San Vincente St
- 15325 Orange Ave Unit B29
- 13955 Arthur Ave Unit 4
- 15351 Orange Ave Unit 17
- 15558 Gundry Ave
- 8032 Rose St Unit 13
- 8032 Rose St Unit 17
- 7230 Richfield St Unit 3
- 7230 Richfield St Unit 2
- 7230 Richfield St Unit 1
- 7230 Richfield St Unit 8
- 7230 Richfield St Unit 7
- 7230 Richfield St Unit 6
- 7230 Richfield St Unit 5
- 7230 Richfield St Unit 4
- 7220 Richfield St
- 7216 Richfield St
- 7216 Richfield St Unit 8
- 7216 Richfield St Unit 7
- 7216 Richfield St Unit 6
- 7216 Richfield St Unit 5
- 7216 Richfield St Unit 4
- 7216 Richfield St Unit 3
- 7216 Richfield St Unit 2
- 7216 Richfield St Unit 1
- 7216 Richfield St Unit 9
- 7246 Richfield St
Your Personal Tour Guide
Ask me questions while you tour the home.