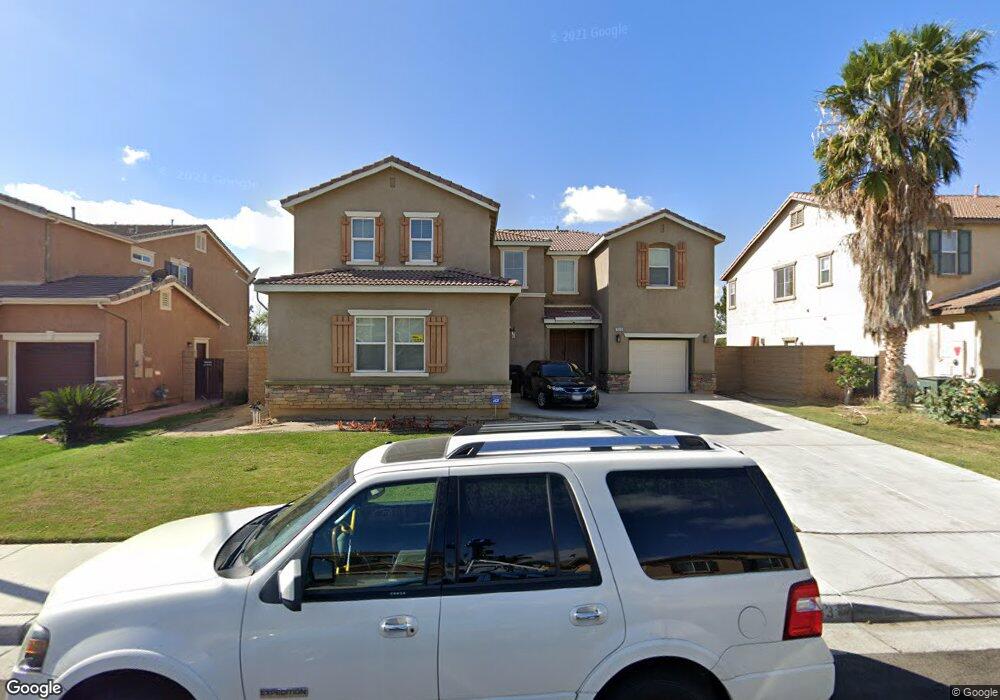
7233 Bay Bridge Rd Corona, CA 92880
Estimated Value: $956,707 - $1,125,000
5
Beds
5
Baths
3,575
Sq Ft
$290/Sq Ft
Est. Value
About This Home
This home is located at 7233 Bay Bridge Rd, Corona, CA 92880 and is currently estimated at $1,037,427, approximately $290 per square foot. 7233 Bay Bridge Rd is a home located in Riverside County with nearby schools including Eastvale Elementary School, River Heights Intermediate School, and Eleanor Roosevelt High School.
Ownership History
Date
Name
Owned For
Owner Type
Purchase Details
Closed on
May 21, 2008
Sold by
Deutsche Bank National Trust Co
Bought by
Harris Carlisa
Current Estimated Value
Home Financials for this Owner
Home Financials are based on the most recent Mortgage that was taken out on this home.
Original Mortgage
$395,789
Interest Rate
6.04%
Mortgage Type
FHA
Purchase Details
Closed on
Feb 6, 2008
Sold by
Calvin Kimberly and Calvin Evan D
Bought by
Deutsche Bank National Trust Co and Indymac Indx Mortgage Loan Trust 2006-Ar
Purchase Details
Closed on
Jul 30, 2007
Sold by
Calvin Evan Davon
Bought by
Calvin Kimberly
Purchase Details
Closed on
Nov 10, 2005
Sold by
Centex Homes
Bought by
Calvin Kimberly and Calvin Evan D
Home Financials for this Owner
Home Financials are based on the most recent Mortgage that was taken out on this home.
Original Mortgage
$495,661
Interest Rate
7.3%
Mortgage Type
Fannie Mae Freddie Mac
Create a Home Valuation Report for This Property
The Home Valuation Report is an in-depth analysis detailing your home's value as well as a comparison with similar homes in the area
Home Values in the Area
Average Home Value in this Area
Purchase History
| Date | Buyer | Sale Price | Title Company |
|---|---|---|---|
| Harris Carlisa | $402,000 | Lsi Title | |
| Deutsche Bank National Trust Co | $504,000 | None Available | |
| Calvin Kimberly | -- | None Available | |
| Calvin Kimberly | $620,000 | Commerce Title Company |
Source: Public Records
Mortgage History
| Date | Status | Borrower | Loan Amount |
|---|---|---|---|
| Previous Owner | Harris Carlisa | $395,789 | |
| Previous Owner | Calvin Kimberly | $495,661 |
Source: Public Records
Tax History Compared to Growth
Tax History
| Year | Tax Paid | Tax Assessment Tax Assessment Total Assessment is a certain percentage of the fair market value that is determined by local assessors to be the total taxable value of land and additions on the property. | Land | Improvement |
|---|---|---|---|---|
| 2025 | $8,096 | $517,658 | $160,960 | $356,698 |
| 2023 | $8,096 | $497,558 | $154,710 | $342,848 |
| 2022 | $8,110 | $487,803 | $151,677 | $336,126 |
| 2021 | $7,943 | $478,239 | $148,703 | $329,536 |
| 2020 | $7,848 | $473,337 | $147,179 | $326,158 |
| 2019 | $7,689 | $464,057 | $144,294 | $319,763 |
| 2018 | $7,564 | $454,959 | $141,465 | $313,494 |
| 2017 | $7,399 | $446,040 | $138,692 | $307,348 |
| 2016 | $7,300 | $437,295 | $135,973 | $301,322 |
| 2015 | $7,169 | $430,729 | $133,932 | $296,797 |
| 2014 | $7,018 | $422,293 | $131,309 | $290,984 |
Source: Public Records
Map
Nearby Homes
- 7313 Bay Bridge Rd
- 7251 Blue Crab Ct
- 7076 Luminaire Ct
- 12947 Radiance Ct
- 12787 Clemson Dr
- 7056 Stratus St
- 7269 Canopy Ln
- 7618 Hertz Place
- 7154 Ohio River Dr
- 13262 Los Robles Ct
- 13478 Quail Run Rd
- 13288 Cactus Flower St
- 6933 Rio Grande Dr
- 7101 Tawny Owl Ct
- 6861 Rio Grande Dr
- 13512 Aspen Leaf Ln
- 6800 Knightsbridge Ct
- 12433 Mississippi Dr
- 6740 Goldy St
- 12545 Current Dr
- 7223 Bay Bridge Rd
- 7243 Bay Bridge Rd
- 7213 Bay Bridge Rd
- 7230 Bay Bridge Rd
- 7250 Bay Bridge Rd
- 7273 Bay Bridge Rd
- 7260 Bay Bridge Rd
- 12966 Eastern Shore Dr
- 7249 Terp Ct
- 7239 Terp Ct
- 7193 Copper Sky
- 12956 Eastern Shore Dr
- 7270 Bay Bridge Rd
- 12997 Luna St
- 7259 Terp Ct
- 7283 Bay Bridge Rd
- 12987 Luna St
- 7183 Copper Sky
- 12946 Eastern Shore Dr