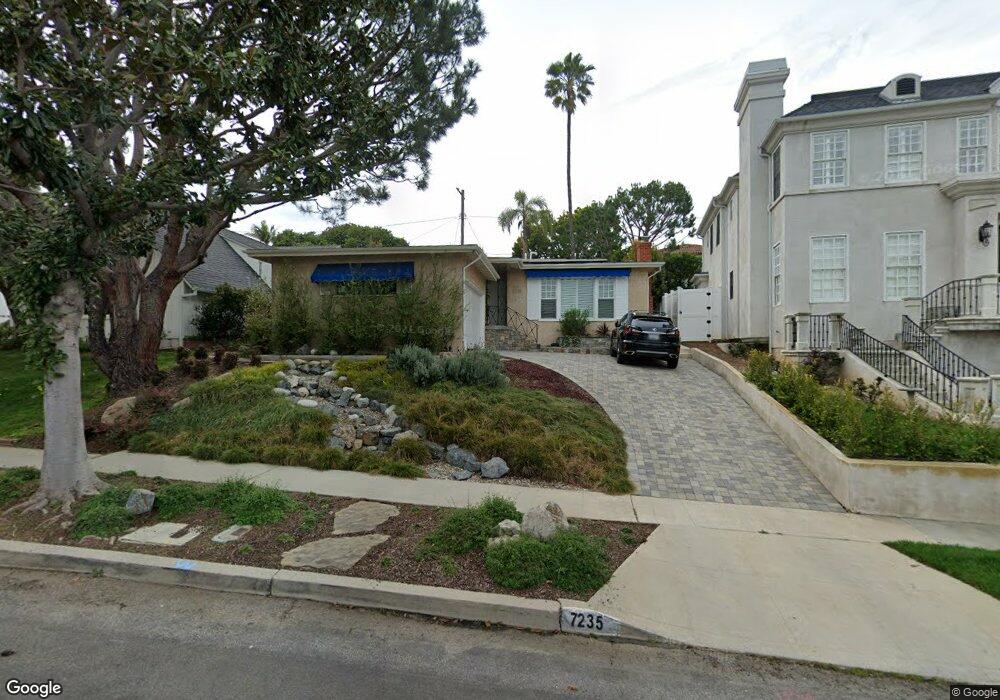
7235 Mccool Ave Los Angeles, CA 90045
Westchester NeighborhoodEstimated Value: $1,534,000 - $2,101,000
3
Beds
2
Baths
1,381
Sq Ft
$1,301/Sq Ft
Est. Value
About This Home
This home is located at 7235 Mccool Ave, Los Angeles, CA 90045 and is currently estimated at $1,796,459, approximately $1,300 per square foot. 7235 Mccool Ave is a home located in Los Angeles County with nearby schools including Cowan Avenue Elementary School, Wright Middle School STEAM Magnet, and Westchester Enriched Sciences Magnets.
Ownership History
Date
Name
Owned For
Owner Type
Purchase Details
Closed on
May 3, 2004
Sold by
Bardwick Peter A
Bought by
Bardwick Peter A and Bardwick Patricia A
Current Estimated Value
Home Financials for this Owner
Home Financials are based on the most recent Mortgage that was taken out on this home.
Original Mortgage
$333,700
Interest Rate
5.38%
Mortgage Type
New Conventional
Purchase Details
Closed on
Aug 5, 2003
Sold by
Bardwick Peter A
Bought by
Bardwick Peter A and Bardwick Patricia A
Purchase Details
Closed on
Dec 30, 1998
Sold by
Bardwick Peter A
Bought by
1998 Peter Alan Bardwick and 1998 Patricia A
Purchase Details
Closed on
Sep 8, 1997
Sold by
Bardwick Peter A
Bought by
Bardwick Peter A and Bardwick Patricia A
Home Financials for this Owner
Home Financials are based on the most recent Mortgage that was taken out on this home.
Original Mortgage
$265,000
Interest Rate
7.45%
Create a Home Valuation Report for This Property
The Home Valuation Report is an in-depth analysis detailing your home's value as well as a comparison with similar homes in the area
Home Values in the Area
Average Home Value in this Area
Purchase History
| Date | Buyer | Sale Price | Title Company |
|---|---|---|---|
| Bardwick Peter A | -- | Diversified Title & Escrow S | |
| Bardwick Md Peter A | -- | Diversified Title & Escrow S | |
| Bardwick Peter A | -- | Nctc | |
| 1998 Peter Alan Bardwick | -- | -- | |
| Bardwick Peter A | -- | South Coast Title |
Source: Public Records
Mortgage History
| Date | Status | Borrower | Loan Amount |
|---|---|---|---|
| Closed | Bardwick Md Peter A | $333,700 | |
| Previous Owner | Bardwick Peter A | $265,000 |
Source: Public Records
Tax History Compared to Growth
Tax History
| Year | Tax Paid | Tax Assessment Tax Assessment Total Assessment is a certain percentage of the fair market value that is determined by local assessors to be the total taxable value of land and additions on the property. | Land | Improvement |
|---|---|---|---|---|
| 2025 | $9,528 | $790,005 | $561,306 | $228,699 |
| 2024 | $9,528 | $774,515 | $550,300 | $224,215 |
| 2023 | $9,347 | $759,329 | $539,510 | $219,819 |
| 2022 | $8,918 | $744,441 | $528,932 | $215,509 |
| 2021 | $8,805 | $729,845 | $518,561 | $211,284 |
| 2019 | $8,542 | $708,199 | $503,181 | $205,018 |
| 2018 | $8,437 | $694,314 | $493,315 | $200,999 |
| 2016 | $8,066 | $667,355 | $474,160 | $193,195 |
| 2015 | $7,948 | $657,332 | $467,038 | $190,294 |
| 2014 | $7,978 | $644,457 | $457,890 | $186,567 |
Source: Public Records
Map
Nearby Homes
- 6534 Kentwood Bluffs Dr
- 7024 Kentwood Ave
- 7404 Kentwood Ave
- 6427 Hedding St
- 7449 Kentwood Ave
- 6882 Arizona Ave
- 7221 Arizona Ave
- 7733 Henefer Ave
- 7403 S Sepulveda Blvd Unit 108
- 7456 Denrock Ave
- 7831 Beland Ave
- 11814 Beatrice St
- 6154 W 75th Place
- 7920 Anise Ave Unit 1
- 8004 El Manor Ave
- 8008 El Manor Ave
- 11946 Aneta St
- 6322 W 78th Place
- 7403 Stewart Ave
- 7833 Denrock Ave
- 7241 Mccool Ave
- 7231 Mccool Ave
- 7247 Mccool Ave
- 7225 Mccool Ave
- 7228 Kentwood Ave
- 7222 Kentwood Ave
- 7300 Kentwood Ave
- 7222 Kentwood Ave
- 7251 Mccool Ave
- 7306 Kentwood Ave
- 7216 Kentwood Ave
- 7221 Mccool Ave
- 7232 Mccool Ave
- 7224 Mccool Ave
- 7240 Mccool Ave
- 7212 Kentwood Ave
- 7314 Kentwood Ave
- 7301 Mccool Ave
- 7246 Mccool Ave
- 7217 Mccool Ave