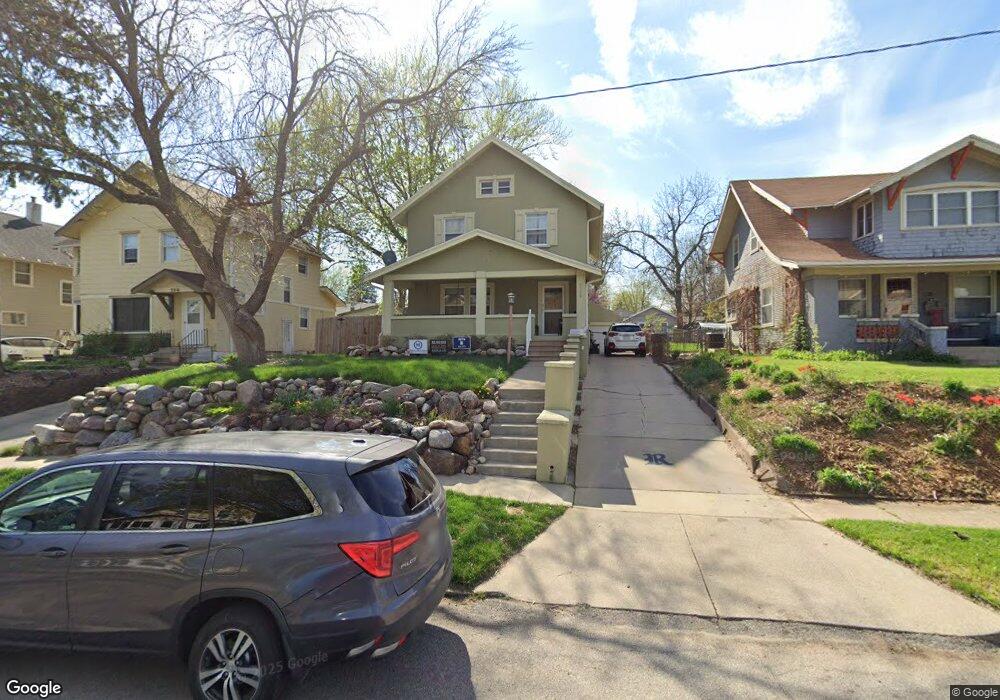
724 36th St Des Moines, IA 50312
North of Grand NeighborhoodEstimated Value: $256,000 - $271,985
3
Beds
1
Bath
1,440
Sq Ft
$185/Sq Ft
Est. Value
About This Home
This home is located at 724 36th St, Des Moines, IA 50312 and is currently estimated at $265,746, approximately $184 per square foot. 724 36th St is a home located in Polk County with nearby schools including Greenwood Elementary School, Callanan Middle School, and Roosevelt High School.
Ownership History
Date
Name
Owned For
Owner Type
Purchase Details
Closed on
Sep 2, 2008
Sold by
Corcoran Timothy J and Corcoran Laurie A
Bought by
Rezek David and Rezek Lori
Current Estimated Value
Home Financials for this Owner
Home Financials are based on the most recent Mortgage that was taken out on this home.
Original Mortgage
$157,817
Outstanding Balance
$103,946
Interest Rate
6.66%
Mortgage Type
FHA
Estimated Equity
$161,800
Purchase Details
Closed on
May 1, 1997
Sold by
Nelson Carl R
Bought by
Corcoran Timothy J and Corcoran Laurie A
Home Financials for this Owner
Home Financials are based on the most recent Mortgage that was taken out on this home.
Original Mortgage
$60,750
Interest Rate
8.05%
Create a Home Valuation Report for This Property
The Home Valuation Report is an in-depth analysis detailing your home's value as well as a comparison with similar homes in the area
Home Values in the Area
Average Home Value in this Area
Purchase History
| Date | Buyer | Sale Price | Title Company |
|---|---|---|---|
| Rezek David | $159,500 | None Available | |
| Corcoran Timothy J | $67,000 | -- |
Source: Public Records
Mortgage History
| Date | Status | Borrower | Loan Amount |
|---|---|---|---|
| Open | Rezek David | $157,817 | |
| Previous Owner | Corcoran Timothy J | $60,750 |
Source: Public Records
Tax History
| Year | Tax Paid | Tax Assessment Tax Assessment Total Assessment is a certain percentage of the fair market value that is determined by local assessors to be the total taxable value of land and additions on the property. | Land | Improvement |
|---|---|---|---|---|
| 2025 | $4,540 | $269,700 | $43,700 | $226,000 |
| 2024 | $4,540 | $241,200 | $38,900 | $202,300 |
| 2023 | $4,908 | $241,200 | $38,900 | $202,300 |
| 2022 | $4,868 | $217,100 | $36,900 | $180,200 |
| 2021 | $4,686 | $217,100 | $36,900 | $180,200 |
| 2020 | $4,864 | $196,400 | $33,700 | $162,700 |
| 2019 | $4,382 | $196,400 | $33,700 | $162,700 |
| 2018 | $4,266 | $171,600 | $29,100 | $142,500 |
| 2017 | $3,794 | $169,100 | $29,100 | $140,000 |
| 2016 | $3,692 | $148,800 | $25,600 | $123,200 |
| 2015 | $3,692 | $148,800 | $25,600 | $123,200 |
| 2014 | $3,472 | $144,500 | $24,700 | $119,800 |
Source: Public Records
Map
Nearby Homes
- 727 37th St
- 676 34th St
- 3621 Woodland Ave
- 636 35th St
- 630 36th St
- 3516 Iola Ave
- 725 40th St
- 3117 Pleasant St
- 710 31st St
- 3406 School St
- 684 31st St
- 3206 Iola Ave
- 3306 School St
- 1002 38th St
- 3001 Center St
- 505 36th St Unit 302
- 3663 Grand Ave Unit 1004
- 3663 Grand Ave Unit 106
- 3663 Grand Ave Unit 104
- 3663 Grand Ave Unit 501
Your Personal Tour Guide
Ask me questions while you tour the home.