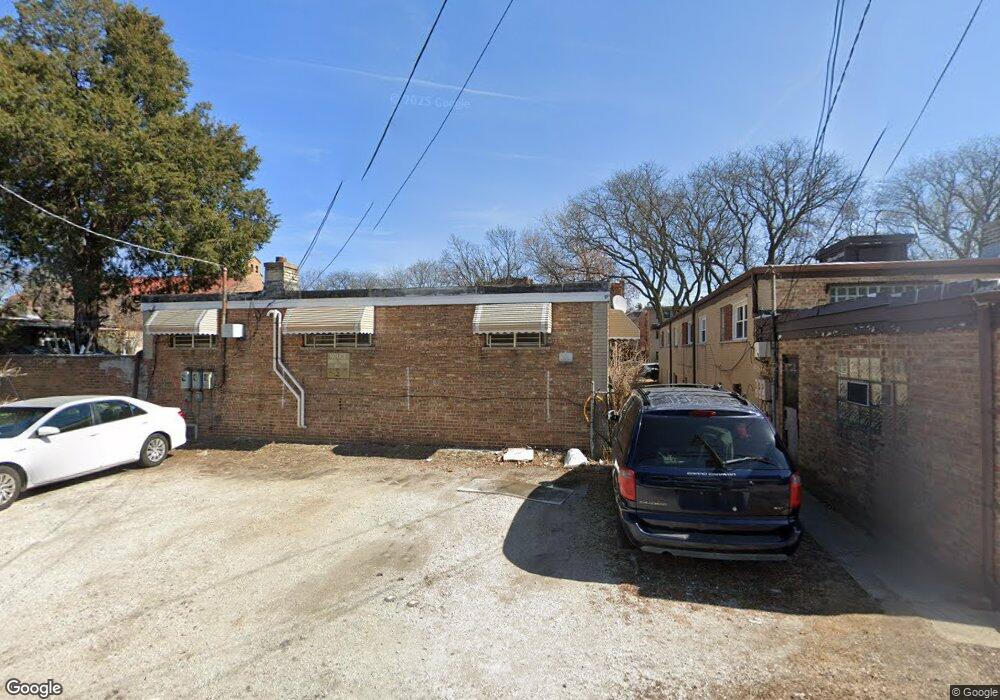
7246 N Claremont Ave Chicago, IL 60645
West Ridge NeighborhoodEstimated Value: $275,000 - $361,000
2
Beds
2
Baths
1,030
Sq Ft
$303/Sq Ft
Est. Value
About This Home
This home is located at 7246 N Claremont Ave, Chicago, IL 60645 and is currently estimated at $312,385, approximately $303 per square foot. 7246 N Claremont Ave is a home located in Cook County with nearby schools including George Armstrong Elementary School, Sullivan High School, and St Margaret Mary Elementary School.
Ownership History
Date
Name
Owned For
Owner Type
Purchase Details
Closed on
Jun 1, 2005
Sold by
Mithani Ahmed
Bought by
Shahid Nargis and Pervez Shahid
Current Estimated Value
Home Financials for this Owner
Home Financials are based on the most recent Mortgage that was taken out on this home.
Original Mortgage
$196,800
Interest Rate
6.12%
Mortgage Type
Unknown
Purchase Details
Closed on
Oct 8, 1998
Sold by
Dihenia Chetna and Dihenia Sharda
Bought by
Mithani Ahmed
Home Financials for this Owner
Home Financials are based on the most recent Mortgage that was taken out on this home.
Original Mortgage
$115,227
Interest Rate
6.83%
Purchase Details
Closed on
Jun 18, 1998
Sold by
Kumar Hemant and Maisuria Hemant
Bought by
Dihenia Chetna
Purchase Details
Closed on
Oct 27, 1994
Sold by
Lovitt Fern R
Bought by
Maisuria Hemant and Dihenia Chetna
Home Financials for this Owner
Home Financials are based on the most recent Mortgage that was taken out on this home.
Original Mortgage
$99,000
Interest Rate
8.75%
Create a Home Valuation Report for This Property
The Home Valuation Report is an in-depth analysis detailing your home's value as well as a comparison with similar homes in the area
Home Values in the Area
Average Home Value in this Area
Purchase History
| Date | Buyer | Sale Price | Title Company |
|---|---|---|---|
| Shahid Nargis | $246,000 | Pntn | |
| Mithani Ahmed | $124,000 | Professional National Title | |
| Dihenia Chetna | -- | -- | |
| Maisuria Hemant | $110,000 | -- |
Source: Public Records
Mortgage History
| Date | Status | Borrower | Loan Amount |
|---|---|---|---|
| Previous Owner | Shahid Nargis | $196,800 | |
| Previous Owner | Mithani Ahmed | $115,227 | |
| Previous Owner | Maisuria Hemant | $99,000 |
Source: Public Records
Tax History Compared to Growth
Tax History
| Year | Tax Paid | Tax Assessment Tax Assessment Total Assessment is a certain percentage of the fair market value that is determined by local assessors to be the total taxable value of land and additions on the property. | Land | Improvement |
|---|---|---|---|---|
| 2024 | $5,208 | $28,001 | $8,132 | $19,869 |
| 2023 | $5,055 | $28,000 | $6,505 | $21,495 |
| 2022 | $5,055 | $28,000 | $6,505 | $21,495 |
| 2021 | $4,961 | $27,999 | $6,505 | $21,494 |
| 2020 | $3,130 | $17,152 | $6,143 | $11,009 |
| 2019 | $3,131 | $19,015 | $6,143 | $12,872 |
| 2018 | $3,078 | $19,015 | $6,143 | $12,872 |
| 2017 | $2,914 | $16,914 | $5,421 | $11,493 |
| 2016 | $2,888 | $16,914 | $5,421 | $11,493 |
| 2015 | $2,619 | $16,914 | $5,421 | $11,493 |
| 2014 | $2,560 | $16,367 | $5,059 | $11,308 |
| 2013 | $2,499 | $16,367 | $5,059 | $11,308 |
Source: Public Records
Map
Nearby Homes
- 7315 N Oakley Ave Unit 1A
- 7223 N Oakley Ave Unit 1E
- 2224 W Touhy Ave Unit 3N
- 7129 N Oakley Ave
- 7234 N Hamilton Ave
- 7249 N Campbell Ave Unit B
- 2175 W Touhy Ave
- 7344 N Ridge Blvd Unit 5C
- 7348 N Ridge Blvd Unit 16B
- 2424 W Estes Ave Unit 1C
- 2424 W Estes Ave Unit 3B
- 2256 W Birchwood Ave
- 2109 W Jarvis Ave Unit 1
- 2522 W Jarvis Ave
- 7228 N Rogers Ave
- 7074 N Ridge Blvd Unit 1E
- 7546 N Oakley Ave
- 2044 W Jarvis Ave Unit 3G
- 2038 W Jarvis Ave Unit 20382D
- 2038 W Jarvis Ave Unit 2F
- 7248 N Claremont Ave
- 2345 W Chase Ave
- 7240 N Claremont Ave
- 7242 N Claremont Ave
- 2341 W Chase Ave
- 7250 N Claremont Ave
- 7244 N Claremont Ave
- 2337 W Chase Ave
- 7247 N Western Ave
- 7238 N Claremont Ave
- 2357 W Chase Ave
- 2357 W Chase Ave
- 2357 W Chase Ave Unit 3
- 7236 N Claremont Ave
- 7243 N Western Ave Unit 2RS
- 7243 N Western Ave Unit 3FS
- 7243 N Western Ave Unit 3RN
- 7243 N Western Ave Unit 2RN
- 7243 N Western Ave Unit 2FN
- 7243 N Western Ave