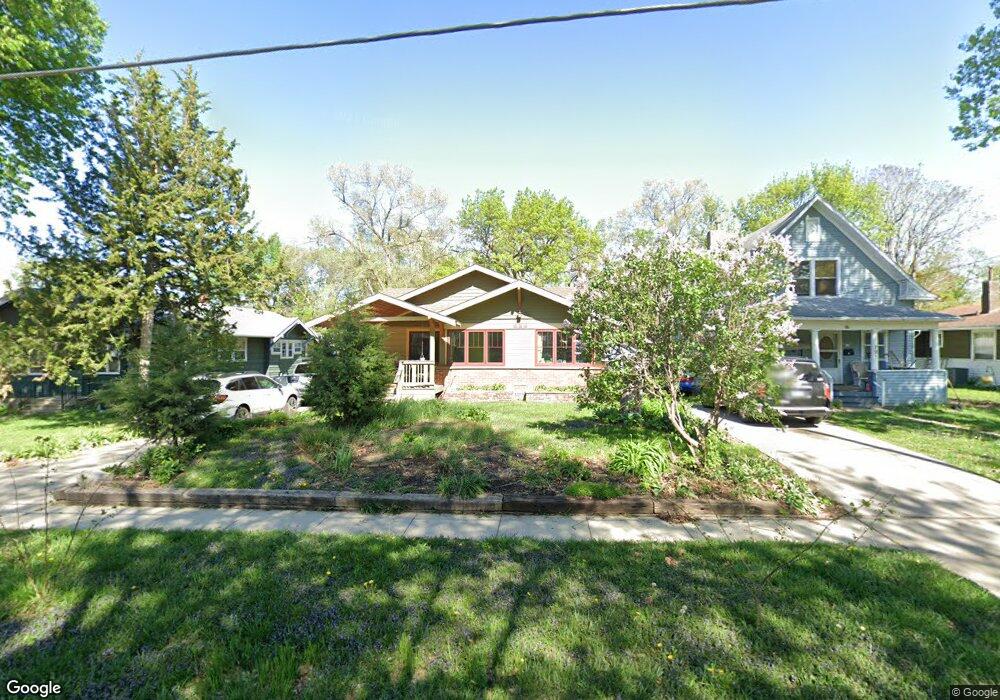
725 38th St Des Moines, IA 50312
North of Grand NeighborhoodEstimated Value: $229,000 - $247,000
2
Beds
1
Bath
1,212
Sq Ft
$194/Sq Ft
Est. Value
About This Home
This home is located at 725 38th St, Des Moines, IA 50312 and is currently estimated at $235,566, approximately $194 per square foot. 725 38th St is a home located in Polk County with nearby schools including Greenwood Elementary School, Roosevelt High School, and Bergman Academy.
Ownership History
Date
Name
Owned For
Owner Type
Purchase Details
Closed on
Oct 25, 2022
Sold by
Ludwig Hannah and Ludwig Nicholas
Bought by
Ludwig Family Revocable Trust
Current Estimated Value
Purchase Details
Closed on
May 25, 2022
Sold by
Hannah Ludwig
Bought by
Ludwig Hannah and Ludwig Nicholas A
Purchase Details
Closed on
Jul 11, 2008
Sold by
Szerencse Jack W and Szerencse Betty L
Bought by
Greve Hannah
Home Financials for this Owner
Home Financials are based on the most recent Mortgage that was taken out on this home.
Original Mortgage
$124,019
Interest Rate
6.15%
Mortgage Type
Purchase Money Mortgage
Create a Home Valuation Report for This Property
The Home Valuation Report is an in-depth analysis detailing your home's value as well as a comparison with similar homes in the area
Home Values in the Area
Average Home Value in this Area
Purchase History
| Date | Buyer | Sale Price | Title Company |
|---|---|---|---|
| Ludwig Family Revocable Trust | -- | -- | |
| Ludwig Hannah | -- | None Listed On Document | |
| Greve Hannah | $124,500 | None Available |
Source: Public Records
Mortgage History
| Date | Status | Borrower | Loan Amount |
|---|---|---|---|
| Previous Owner | Greve Hannah | $124,019 |
Source: Public Records
Tax History Compared to Growth
Tax History
| Year | Tax Paid | Tax Assessment Tax Assessment Total Assessment is a certain percentage of the fair market value that is determined by local assessors to be the total taxable value of land and additions on the property. | Land | Improvement |
|---|---|---|---|---|
| 2025 | $3,888 | $231,900 | $49,400 | $182,500 |
| 2024 | $3,888 | $208,100 | $43,900 | $164,200 |
| 2023 | $4,170 | $208,100 | $43,900 | $164,200 |
| 2022 | $4,136 | $185,800 | $41,700 | $144,100 |
| 2021 | $3,816 | $185,800 | $41,700 | $144,100 |
| 2020 | $3,958 | $161,500 | $38,000 | $123,500 |
| 2019 | $3,424 | $161,500 | $38,000 | $123,500 |
| 2018 | $3,384 | $135,900 | $32,800 | $103,100 |
| 2017 | $3,016 | $135,900 | $32,800 | $103,100 |
| 2016 | $2,932 | $120,000 | $28,900 | $91,100 |
| 2015 | $2,932 | $120,000 | $28,900 | $91,100 |
| 2014 | $2,698 | $114,300 | $27,300 | $87,000 |
Source: Public Records
Map
Nearby Homes