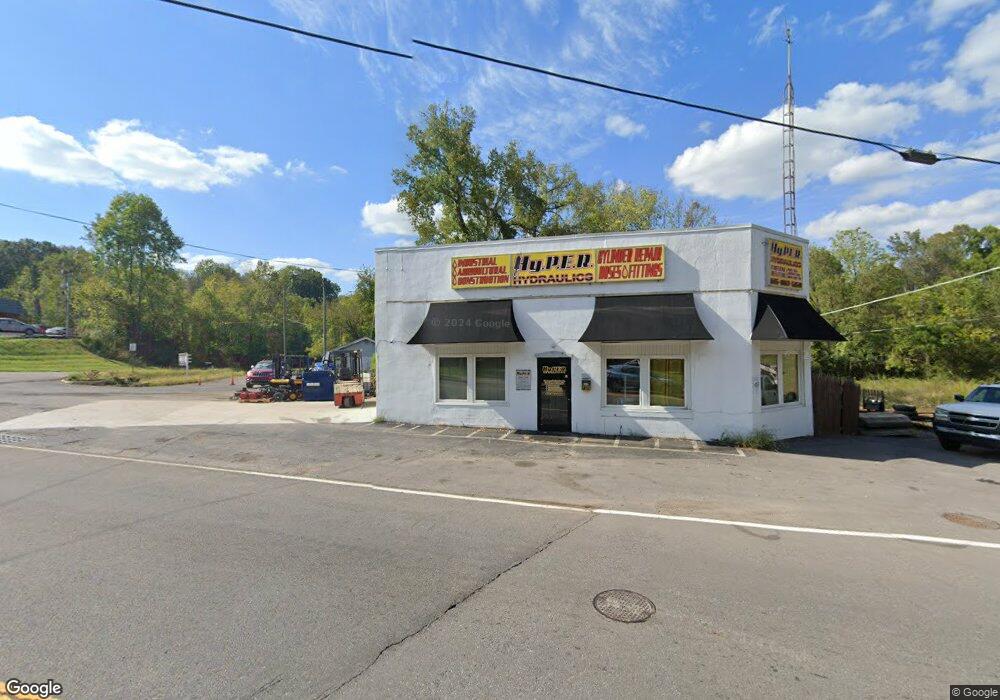
725 5th Ave W Springfield, TN 37172
Estimated Value: $341,535
--
Bed
--
Bath
2,380
Sq Ft
$144/Sq Ft
Est. Value
About This Home
This home is located at 725 5th Ave W, Springfield, TN 37172 and is currently estimated at $341,535, approximately $143 per square foot. 725 5th Ave W is a home located in Robertson County with nearby schools including Cheatham Park Elementary School, Westside Elementary School, and Innovation Academy.
Ownership History
Date
Name
Owned For
Owner Type
Purchase Details
Closed on
Mar 25, 2020
Sold by
Quintanilla Antonio Sibrian
Bought by
Hy P E R Llc
Current Estimated Value
Purchase Details
Closed on
Apr 4, 2018
Sold by
Worsham John Derek
Bought by
Quintanilla Antonio Sibrian
Purchase Details
Closed on
Jun 17, 2016
Sold by
Anderson Steven J
Bought by
Worsham John Derek
Purchase Details
Closed on
Nov 2, 2001
Sold by
Thomas George H
Bought by
Betts Brandon S
Purchase Details
Closed on
Mar 6, 1986
Bought by
Anderson Steven J and Tommy Anderson
Create a Home Valuation Report for This Property
The Home Valuation Report is an in-depth analysis detailing your home's value as well as a comparison with similar homes in the area
Home Values in the Area
Average Home Value in this Area
Purchase History
| Date | Buyer | Sale Price | Title Company |
|---|---|---|---|
| Hy P E R Llc | $225,000 | None Available | |
| Quintanilla Antonio Sibrian | $157,500 | None Available | |
| Worsham John Derek | $80,000 | -- | |
| Betts Brandon S | $107,500 | -- | |
| Anderson Steven J | -- | -- |
Source: Public Records
Tax History Compared to Growth
Tax History
| Year | Tax Paid | Tax Assessment Tax Assessment Total Assessment is a certain percentage of the fair market value that is determined by local assessors to be the total taxable value of land and additions on the property. | Land | Improvement |
|---|---|---|---|---|
| 2024 | -- | $81,920 | $21,600 | $60,320 |
| 2023 | $2,053 | $81,920 | $21,600 | $60,320 |
| 2022 | $2,131 | $58,440 | $13,320 | $45,120 |
| 2021 | $1,395 | $58,440 | $13,320 | $45,120 |
| 2020 | $1,395 | $38,240 | $13,320 | $24,920 |
| 2019 | $34,511 | $31,480 | $13,320 | $18,160 |
| 2018 | $1,148 | $31,480 | $13,320 | $18,160 |
| 2017 | $1,239 | $28,920 | $12,000 | $16,920 |
| 2016 | $1,239 | $28,920 | $12,000 | $16,920 |
| 2015 | $1,203 | $28,920 | $12,000 | $16,920 |
| 2014 | $1,203 | $28,920 | $12,000 | $16,920 |
Source: Public Records
Map
Nearby Homes