Estimated Value: $454,938 - $504,000
3
Beds
2
Baths
1,349
Sq Ft
$355/Sq Ft
Est. Value
About This Home
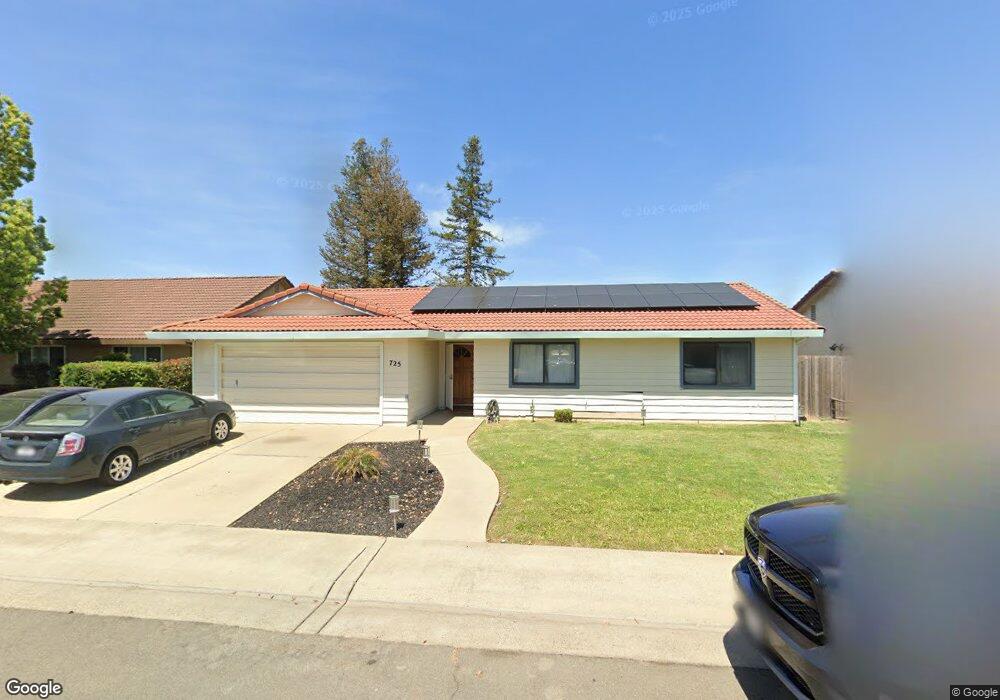
This home is located at 725 Cimmaron Ct, Galt, CA 95632 and is currently estimated at $478,235, approximately $354 per square foot. 725 Cimmaron Ct is a home located in Sacramento County with nearby schools including River Oaks Elementary School, Robert L. McCaffrey Middle School, and Liberty Ranch High School.
Ownership History
Date
Name
Owned For
Owner Type
Purchase Details
Closed on
Mar 29, 2006
Sold by
Lubers Alice M
Bought by
Lubers Sandra J and Lubers Alice M
Current Estimated Value
Purchase Details
Closed on
Mar 25, 1999
Sold by
Lubers Alice M and Lubers Family Trust
Bought by
Lubers Alice M
Home Financials for this Owner
Home Financials are based on the most recent Mortgage that was taken out on this home.
Original Mortgage
$15,000
Interest Rate
6.79%
Mortgage Type
Credit Line Revolving
Purchase Details
Closed on
Apr 29, 1998
Sold by
Lubers Alice M
Bought by
Lubers Alice M and The Lubers Family Trust
Purchase Details
Closed on
Oct 9, 1996
Sold by
Faine Robert Joseph and Faine Cheryl Ann
Bought by
Lubers Fidel L and Lubers Alice M
Home Financials for this Owner
Home Financials are based on the most recent Mortgage that was taken out on this home.
Original Mortgage
$90,000
Interest Rate
8.37%
Create a Home Valuation Report for This Property
The Home Valuation Report is an in-depth analysis detailing your home's value as well as a comparison with similar homes in the area
Home Values in the Area
Average Home Value in this Area
Purchase History
We collect this data history from publicly available records. To have your information removed, we recommend requesting removal directly through your county’s website.
| Date | Buyer | Sale Price | Title Company |
|---|---|---|---|
| Lubers Sandra J | -- | First American Heritage Titl | |
| Lubers Alice M | -- | Financial Title Company | |
| Lubers Alice M | -- | -- | |
| Lubers Fidel L | $112,500 | Stewart Title |
Source: Public Records
Mortgage History
We collect this data history from publicly available records. To have your information removed, we recommend requesting removal directly through your county’s website.
| Date | Status | Borrower | Loan Amount |
|---|---|---|---|
| Closed | Lubers Alice M | $15,000 | |
| Open | Lubers Alice M | $92,500 | |
| Closed | Lubers Fidel L | $90,000 |
Source: Public Records
Tax History
| Year | Tax Paid | Tax Assessment Tax Assessment Total Assessment is a certain percentage of the fair market value that is determined by local assessors to be the total taxable value of land and additions on the property. | Land | Improvement |
|---|---|---|---|---|
| 2025 | $2,016 | $183,197 | $56,986 | $126,211 |
| 2024 | $2,016 | $179,606 | $55,869 | $123,737 |
| 2023 | $1,982 | $176,085 | $54,774 | $121,311 |
| 2022 | $1,902 | $172,633 | $53,700 | $118,933 |
| 2021 | $1,905 | $169,249 | $52,648 | $116,601 |
| 2020 | $1,889 | $167,515 | $52,109 | $115,406 |
| 2019 | $1,842 | $164,232 | $51,088 | $113,144 |
| 2018 | $1,839 | $161,013 | $50,087 | $110,926 |
| 2017 | $1,767 | $157,856 | $49,105 | $108,751 |
| 2016 | $1,698 | $154,762 | $48,143 | $106,619 |
| 2015 | $1,639 | $152,438 | $47,420 | $105,018 |
| 2014 | $1,635 | $149,453 | $46,492 | $102,961 |
Source: Public Records
Map
Nearby Homes
- 709 Prairie Ct
- 825 Polar Bear Cir
- 712 Parkridge Dr
- 829 Grizzly Mesa Ct
- 787 Twin Hills Dr
- 692 Arlene Ct
- 954 Port Ashton Ct
- 851 Pecan Tree Ln
- 958 Port Ashton Ct
- 855 Pecan Tree Ln
- 856 Pecan Tree Ln
- 854 Pecan Tree Ln
- 852 Pecan Tree Ln
- 859 Pecan Tree Ln
- 863 Pecan Tree Ln
- 777 Cobble Hill Way
- 905 Millson Ct
- 773 Ashboro Ln
- 877 Bateman Way
- 724 Adare Way
- 717 Cimmaron Ct
- 733 Cimmaron Ct
- 726 Prairie Ct
- 734 Prairie Ct
- 741 Cimmaron Ct
- 718 Prairie Ct
- 742 Prairie Ct
- 734 Cimmaron Ct
- 709 Cimmaron Ct
- 718 Cimmaron Ct
- 742 Cimmaron Ct
- 710 Prairie Ct
- 701 Cimmaron Ct
- 710 Cimmaron Ct
- 702 Cimmaron Ct
- 733 Winn Dr
- 741 Winn Dr
- 725 Winn Dr
- 741 Prairie Ct
- 749 Alta Vista Ct
Your Personal Tour Guide
Ask me questions while you tour the home.