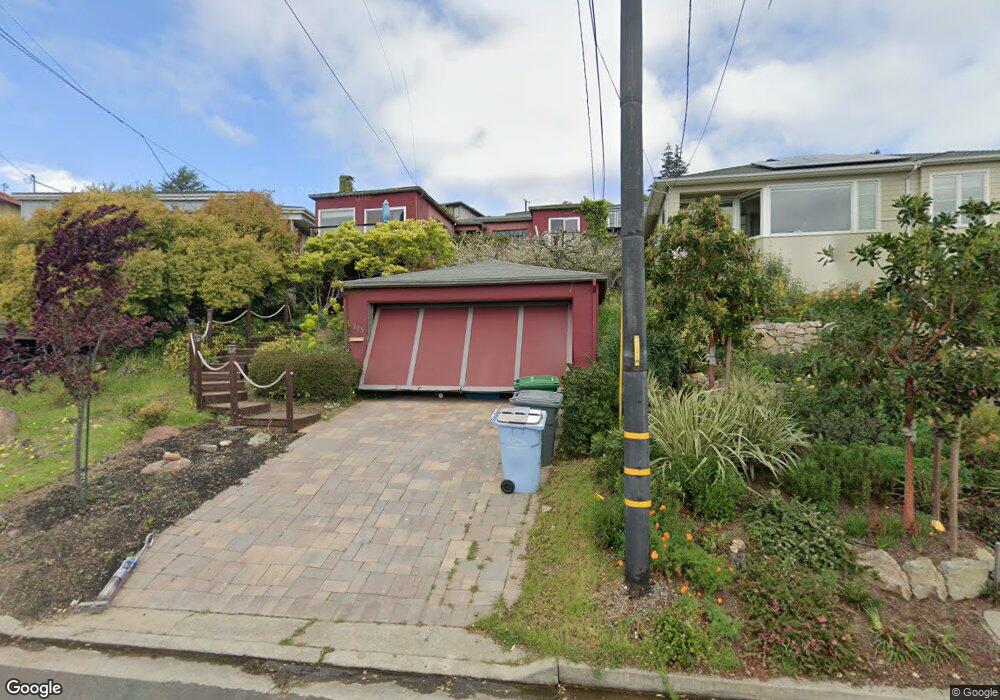
725 Grizzly Peak Blvd Berkeley, CA 94708
Berkeley Hills NeighborhoodEstimated Value: $1,026,000 - $1,300,000
2
Beds
1
Bath
1,331
Sq Ft
$889/Sq Ft
Est. Value
About This Home
This home is located at 725 Grizzly Peak Blvd, Berkeley, CA 94708 and is currently estimated at $1,182,637, approximately $888 per square foot. 725 Grizzly Peak Blvd is a home located in Alameda County with nearby schools including Cragmont Elementary School, Berkeley Arts Magnet at Whittier School, and Washington Elementary School.
Ownership History
Date
Name
Owned For
Owner Type
Purchase Details
Closed on
Jan 7, 2011
Sold by
Us Bank National Association
Bought by
Berger Ralph and Keefe Eileen
Current Estimated Value
Home Financials for this Owner
Home Financials are based on the most recent Mortgage that was taken out on this home.
Original Mortgage
$367,600
Interest Rate
4.74%
Mortgage Type
New Conventional
Purchase Details
Closed on
Jul 16, 2010
Sold by
Guice Charles E and Guice Jill S
Bought by
U S Bank National Association
Purchase Details
Closed on
Jun 7, 1994
Sold by
Millikan Donald H and Millikan Flavia C
Bought by
Guice Charles E and Guice Jill S
Home Financials for this Owner
Home Financials are based on the most recent Mortgage that was taken out on this home.
Original Mortgage
$253,350
Interest Rate
5.25%
Create a Home Valuation Report for This Property
The Home Valuation Report is an in-depth analysis detailing your home's value as well as a comparison with similar homes in the area
Home Values in the Area
Average Home Value in this Area
Purchase History
| Date | Buyer | Sale Price | Title Company |
|---|---|---|---|
| Berger Ralph | $459,500 | Orange Coast Title Lender Se | |
| U S Bank National Association | $649,900 | Accommodation | |
| Guice Charles E | $281,500 | Placer Title Company |
Source: Public Records
Mortgage History
| Date | Status | Borrower | Loan Amount |
|---|---|---|---|
| Previous Owner | Berger Ralph | $367,600 | |
| Previous Owner | Guice Charles E | $253,350 |
Source: Public Records
Tax History Compared to Growth
Tax History
| Year | Tax Paid | Tax Assessment Tax Assessment Total Assessment is a certain percentage of the fair market value that is determined by local assessors to be the total taxable value of land and additions on the property. | Land | Improvement |
|---|---|---|---|---|
| 2025 | $9,698 | $588,664 | $176,535 | $412,129 |
| 2024 | $9,698 | $577,126 | $173,075 | $404,051 |
| 2023 | $9,487 | $565,813 | $169,682 | $396,131 |
| 2022 | $9,301 | $554,721 | $166,356 | $388,365 |
| 2021 | $9,311 | $543,845 | $163,094 | $380,751 |
| 2020 | $8,788 | $538,272 | $161,423 | $376,849 |
| 2019 | $8,415 | $527,721 | $158,259 | $369,462 |
| 2018 | $8,265 | $517,378 | $155,157 | $362,221 |
| 2017 | $7,962 | $507,237 | $152,116 | $355,121 |
| 2016 | $7,687 | $497,293 | $149,134 | $348,159 |
| 2015 | $7,581 | $489,826 | $146,894 | $342,932 |
| 2014 | $7,471 | $480,232 | $144,017 | $336,215 |
Source: Public Records
Map
Nearby Homes
- 680 Grizzly Peak Blvd
- 614 Cragmont Ave
- 946 Creston Rd
- 715 Santa Barbara Rd
- 74 Florida Ave
- 962 Regal Rd
- 826 Indian Rock Ave
- 971 Santa Barbara Rd
- 411 Vassar Ave
- 589 San Luis Rd
- 1130 Oxford St
- 581 Arlington Ave
- 1110 Sterling Ave
- 1136 Keith Ave
- 1165 Cragmont Ave
- 256 Cambridge Ave
- 1141 Oxford St
- 1124 Walnut St
- 1149 Amador Ave
- 207 Cambridge Ave
- 719 Grizzly Peak Blvd
- 731 Grizzly Peak Blvd
- 711 Grizzly Peak Blvd
- 735 Grizzly Peak Blvd
- 720 Creston Rd
- 726 Creston Rd
- 714 Creston Rd
- 728 Creston Rd
- 705 Grizzly Peak Blvd
- 739 Grizzly Peak Blvd
- 734 Creston Rd
- 720 Grizzly Peak Blvd
- 706 Creston Rd
- 708 Grizzly Peak Blvd
- 726 Grizzly Peak Blvd
- 730 Grizzly Peak Blvd
- 745 Grizzly Peak Blvd
- 700 Creston Rd
- 744 Creston Rd
- 699 Grizzly Peak Blvd