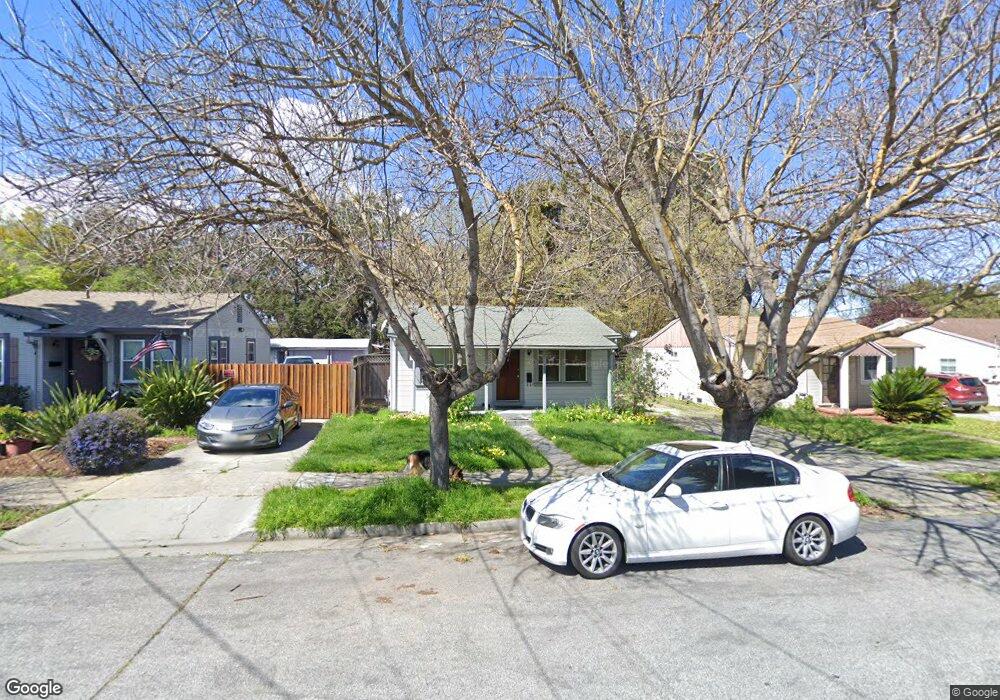
725 Illinois Ave San Jose, CA 95125
Willow Glen NeighborhoodEstimated Value: $876,000 - $1,202,000
2
Beds
1
Bath
856
Sq Ft
$1,242/Sq Ft
Est. Value
About This Home
This home is located at 725 Illinois Ave, San Jose, CA 95125 and is currently estimated at $1,063,130, approximately $1,241 per square foot. 725 Illinois Ave is a home located in Santa Clara County with nearby schools including Gardner Elementary School, Herbert Hoover Middle School, and Abraham Lincoln High.
Ownership History
Date
Name
Owned For
Owner Type
Purchase Details
Closed on
May 16, 2002
Sold by
Lang Robert and Vo Ann Maire
Bought by
Ortiz Manuela D
Current Estimated Value
Home Financials for this Owner
Home Financials are based on the most recent Mortgage that was taken out on this home.
Original Mortgage
$380,000
Outstanding Balance
$160,008
Interest Rate
6.89%
Mortgage Type
Stand Alone First
Estimated Equity
$903,122
Purchase Details
Closed on
Oct 27, 1998
Sold by
Walker Brian
Bought by
Lang Robert and Vo Ann Maire
Home Financials for this Owner
Home Financials are based on the most recent Mortgage that was taken out on this home.
Original Mortgage
$176,800
Interest Rate
6.61%
Purchase Details
Closed on
Oct 10, 1996
Sold by
Brasher Jamie S
Bought by
Walker Brian
Home Financials for this Owner
Home Financials are based on the most recent Mortgage that was taken out on this home.
Original Mortgage
$146,000
Interest Rate
7.62%
Purchase Details
Closed on
Sep 24, 1994
Sold by
Brasher Jamie S
Bought by
Brasher Jamie Scott
Create a Home Valuation Report for This Property
The Home Valuation Report is an in-depth analysis detailing your home's value as well as a comparison with similar homes in the area
Home Values in the Area
Average Home Value in this Area
Purchase History
| Date | Buyer | Sale Price | Title Company |
|---|---|---|---|
| Ortiz Manuela D | $380,000 | Chicago Title Co | |
| Lang Robert | $221,000 | Financial Title Company | |
| Walker Brian | $176,000 | Old Republic Title Company | |
| Brasher Jamie Scott | -- | -- |
Source: Public Records
Mortgage History
| Date | Status | Borrower | Loan Amount |
|---|---|---|---|
| Open | Ortiz Manuela D | $380,000 | |
| Previous Owner | Lang Robert | $176,800 | |
| Previous Owner | Walker Brian | $146,000 | |
| Closed | Lang Robert | $22,100 |
Source: Public Records
Tax History Compared to Growth
Tax History
| Year | Tax Paid | Tax Assessment Tax Assessment Total Assessment is a certain percentage of the fair market value that is determined by local assessors to be the total taxable value of land and additions on the property. | Land | Improvement |
|---|---|---|---|---|
| 2025 | $7,898 | $560,982 | $280,380 | $280,602 |
| 2024 | $7,898 | $549,983 | $274,883 | $275,100 |
| 2023 | $7,729 | $539,200 | $269,494 | $269,706 |
| 2022 | $7,663 | $528,628 | $264,210 | $264,418 |
| 2021 | $7,480 | $518,264 | $259,030 | $259,234 |
| 2020 | $7,289 | $512,950 | $256,374 | $256,576 |
| 2019 | $7,122 | $502,894 | $251,348 | $251,546 |
| 2018 | $7,041 | $493,034 | $246,420 | $246,614 |
| 2017 | $6,978 | $483,368 | $241,589 | $241,779 |
| 2016 | $6,814 | $473,891 | $236,852 | $237,039 |
| 2015 | $6,807 | $466,774 | $233,295 | $233,479 |
| 2014 | $6,325 | $457,632 | $228,726 | $228,906 |
Source: Public Records
Map
Nearby Homes
- 841 Willis Ave
- 470 Jerome St
- 715 Harrison St
- 408 Fuller Ave
- 546 Coe Ave
- 502 Hannah St
- 747 Coe Ave
- 986 Spencer Ave
- 439 Snyder Ave
- 975 Prevost St
- 1025 Delmas Ave
- 943 Riverside Dr
- 809 Auzerais Ave Unit 429
- 809 Auzerais Ave Unit 341
- 311 Bautista Place
- 1124 Delmas Ave
- 935 Chabrant Way
- 1206 Clark St
- 501 Minnesota Ave
- 1044 Lincoln Ave
- 723 Illinois Ave
- 729 Illinois Ave
- 717 Illinois Ave
- 731 Illinois Ave
- 739 Illinois Ave
- 711 Illinois Ave
- 737 Illinois Ave
- 745 Illinois Ave
- 747 Illinois Ave
- 722 Illinois Ave
- 728 Illinois Ave
- 730 Illinois Ave
- 724 Illinois Ave
- 560 W Virginia St
- 716 Illinois Ave
- 734 Illinois Ave
- 570 W Virginia St
- 552 W Virginia St
- 720 Illinois Ave
- 740 Illinois Ave