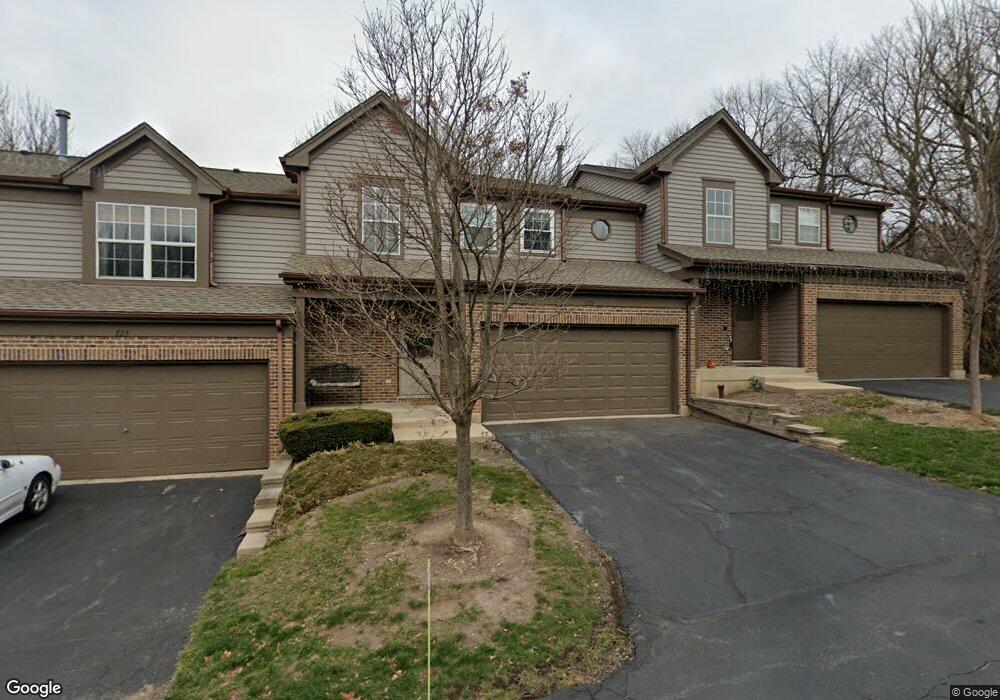
725 Longwood Dr Unit 1 Algonquin, IL 60102
Estimated Value: $290,000 - $338,000
3
Beds
3
Baths
1,474
Sq Ft
$210/Sq Ft
Est. Value
About This Home
This home is located at 725 Longwood Dr Unit 1, Algonquin, IL 60102 and is currently estimated at $309,757, approximately $210 per square foot. 725 Longwood Dr Unit 1 is a home located in McHenry County with nearby schools including Eastview Elementary School, Algonquin Middle School, and Dundee-Crown High School.
Ownership History
Date
Name
Owned For
Owner Type
Purchase Details
Closed on
Feb 10, 2011
Sold by
Bookout Richard and Hlobil Kendra L
Bought by
Novak Paula
Current Estimated Value
Purchase Details
Closed on
Aug 16, 2005
Sold by
Byers Brian H and Byers Heather J
Bought by
Bookout Richard and Bookout Kendra
Home Financials for this Owner
Home Financials are based on the most recent Mortgage that was taken out on this home.
Original Mortgage
$161,840
Interest Rate
6.6%
Mortgage Type
Unknown
Purchase Details
Closed on
Nov 21, 2001
Sold by
Nelson Brian D and Nelson Michele M
Bought by
Byers Brian H and Byers Heather J
Home Financials for this Owner
Home Financials are based on the most recent Mortgage that was taken out on this home.
Original Mortgage
$134,300
Interest Rate
6.64%
Create a Home Valuation Report for This Property
The Home Valuation Report is an in-depth analysis detailing your home's value as well as a comparison with similar homes in the area
Home Values in the Area
Average Home Value in this Area
Purchase History
| Date | Buyer | Sale Price | Title Company |
|---|---|---|---|
| Novak Paula | $131,000 | Baird & Warner Title Service | |
| Bookout Richard | $190,400 | -- | |
| Byers Brian H | $158,000 | Plm Title Company |
Source: Public Records
Mortgage History
| Date | Status | Borrower | Loan Amount |
|---|---|---|---|
| Previous Owner | Bookout Richard | $161,840 | |
| Previous Owner | Byers Brian H | $134,300 |
Source: Public Records
Tax History Compared to Growth
Tax History
| Year | Tax Paid | Tax Assessment Tax Assessment Total Assessment is a certain percentage of the fair market value that is determined by local assessors to be the total taxable value of land and additions on the property. | Land | Improvement |
|---|---|---|---|---|
| 2024 | $5,154 | $73,884 | $15,486 | $58,398 |
| 2023 | $4,862 | $66,080 | $13,850 | $52,230 |
| 2022 | $4,375 | $57,018 | $8,282 | $48,736 |
| 2021 | $4,181 | $53,119 | $7,716 | $45,403 |
| 2020 | $4,062 | $51,239 | $7,443 | $43,796 |
| 2019 | $3,952 | $49,042 | $7,124 | $41,918 |
| 2018 | $3,352 | $41,170 | $6,581 | $34,589 |
| 2017 | $3,197 | $38,785 | $6,200 | $32,585 |
| 2016 | $3,128 | $36,377 | $5,815 | $30,562 |
| 2013 | -- | $37,756 | $5,425 | $32,331 |
Source: Public Records
Map
Nearby Homes
- 14 Oxford Ct
- 903 Old Oak Cir
- 911 Old Oak Cir Unit 1
- 1188 E Algonquin Rd
- 920 Plymouth Ct
- 620 Old Oak Cir
- 925 N River Rd
- 600 E Algonquin Rd
- 2 Sunset Ln
- 1011 Wesley Ln
- 0 River Dr N Unit MRD12473279
- 420 N Harrison St
- 1659 E Algonquin Rd
- 1730 Tanglewood Dr
- Lot 4 b Ryan Pkwy
- 1770 E Algonquin Rd
- 69 Alice St
- 1439 Lowe Dr
- 2008 Clematis Dr
- 1782 Cumberland Pkwy
- 727 Longwood Dr
- 723 Longwood Dr
- 721 Longwood Dr
- 715 Longwood Dr
- 713 Longwood Dr
- 717 Longwood Dr
- 711 Longwood Dr
- 735 Longwood Dr
- 737 Longwood Dr
- 733 Longwood Dr Unit 1
- 731 Longwood Dr
- 18 Oxford Ct
- 16 Oxford Ct
- 705 Longwood Dr Unit 1
- 703 Longwood Dr
- 20 Oxford Ct
- 707 Longwood Dr Unit 1
- 701 Longwood Dr
- 976 Old Oak Cir
- 974 Old Oak Cir