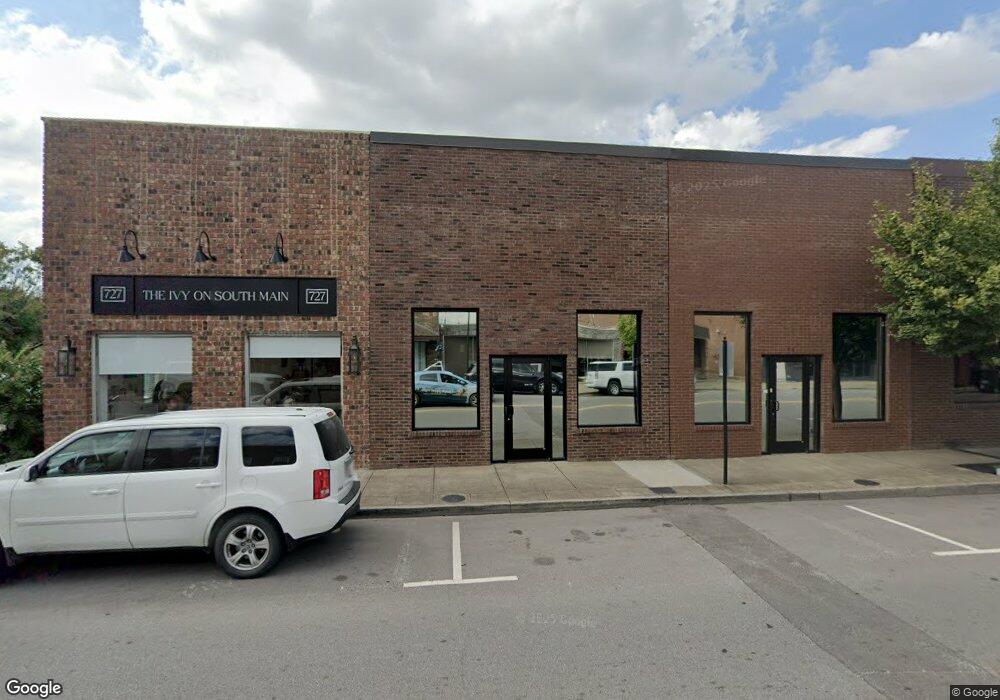
725 S Main St Springfield, TN 37172
--
Bed
--
Bath
2,049
Sq Ft
2,614
Sq Ft Lot
About This Home
This home is located at 725 S Main St, Springfield, TN 37172. 725 S Main St is a home located in Robertson County with nearby schools including Cheatham Park Elementary School, Westside Elementary School, and Innovation Academy.
Ownership History
Date
Name
Owned For
Owner Type
Purchase Details
Closed on
Jan 31, 2018
Sold by
Head Properties
Bought by
Asi Properties Llc and Asi Properties Llc
Home Financials for this Owner
Home Financials are based on the most recent Mortgage that was taken out on this home.
Original Mortgage
$188,000
Interest Rate
3.94%
Mortgage Type
Commercial
Purchase Details
Closed on
Dec 4, 1992
Bought by
Head Dorris
Purchase Details
Closed on
Aug 10, 1983
Bought by
Clemons George E
Create a Home Valuation Report for This Property
The Home Valuation Report is an in-depth analysis detailing your home's value as well as a comparison with similar homes in the area
Home Values in the Area
Average Home Value in this Area
Purchase History
| Date | Buyer | Sale Price | Title Company |
|---|---|---|---|
| Asi Properties Llc | $230,000 | Warranty Title Ins Co | |
| Head Dorris | $18,000 | -- | |
| Clemons George E | -- | -- |
Source: Public Records
Mortgage History
| Date | Status | Borrower | Loan Amount |
|---|---|---|---|
| Closed | Asi Properties Llc | $188,000 |
Source: Public Records
Tax History Compared to Growth
Tax History
| Year | Tax Paid | Tax Assessment Tax Assessment Total Assessment is a certain percentage of the fair market value that is determined by local assessors to be the total taxable value of land and additions on the property. | Land | Improvement |
|---|---|---|---|---|
| 2024 | -- | $60,680 | $14,880 | $45,800 |
| 2023 | $1,520 | $60,680 | $14,880 | $45,800 |
| 2022 | $1,800 | $49,360 | $5,320 | $44,040 |
| 2021 | $1,134 | $49,360 | $5,320 | $44,040 |
| 2020 | $5 | $31,080 | $5,320 | $25,760 |
| 2019 | $34,101 | $31,080 | $5,320 | $25,760 |
| 2018 | $1,134 | $31,080 | $5,320 | $25,760 |
| 2017 | $1,136 | $26,520 | $4,800 | $21,720 |
| 2016 | $1,136 | $26,520 | $4,800 | $21,720 |
| 2015 | $1,103 | $26,520 | $4,800 | $21,720 |
| 2014 | $1,103 | $26,520 | $4,800 | $21,720 |
Source: Public Records
Map
Nearby Homes