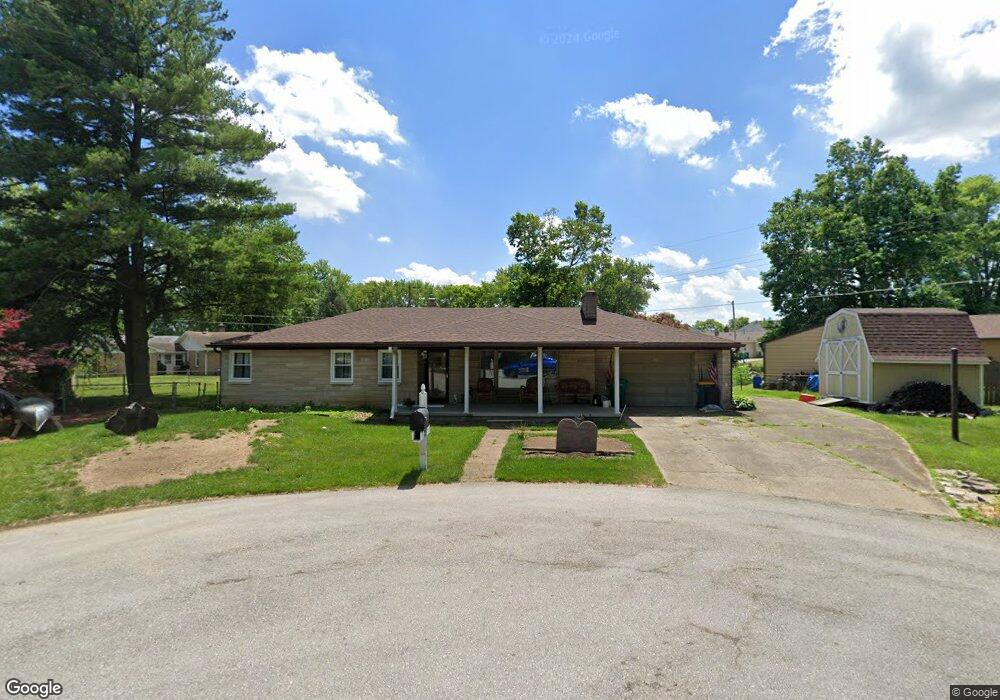
725 Sharon Ct Plainfield, IN 46168
Estimated Value: $268,185 - $285,000
3
Beds
1
Bath
1,839
Sq Ft
$153/Sq Ft
Est. Value
About This Home
This home is located at 725 Sharon Ct, Plainfield, IN 46168 and is currently estimated at $280,796, approximately $152 per square foot. 725 Sharon Ct is a home located in Hendricks County with nearby schools including Central Elementary School, Plainfield Community Middle School, and Plainfield High School.
Ownership History
Date
Name
Owned For
Owner Type
Purchase Details
Closed on
Nov 26, 2003
Sold by
Jellison Ryan Douglas and Jellison Heather Lynne
Bought by
Clampitt Harlan L and Clampitt Sondra C
Current Estimated Value
Home Financials for this Owner
Home Financials are based on the most recent Mortgage that was taken out on this home.
Original Mortgage
$110,700
Outstanding Balance
$49,786
Interest Rate
6.03%
Mortgage Type
VA
Estimated Equity
$231,010
Create a Home Valuation Report for This Property
The Home Valuation Report is an in-depth analysis detailing your home's value as well as a comparison with similar homes in the area
Home Values in the Area
Average Home Value in this Area
Purchase History
| Date | Buyer | Sale Price | Title Company |
|---|---|---|---|
| Clampitt Harlan L | -- | Mid America Title Co Inc |
Source: Public Records
Mortgage History
| Date | Status | Borrower | Loan Amount |
|---|---|---|---|
| Open | Clampitt Harlan L | $110,700 |
Source: Public Records
Tax History
| Year | Tax Paid | Tax Assessment Tax Assessment Total Assessment is a certain percentage of the fair market value that is determined by local assessors to be the total taxable value of land and additions on the property. | Land | Improvement |
|---|---|---|---|---|
| 2025 | $1,437 | $229,300 | $50,000 | $179,300 |
| 2024 | $1,437 | $206,900 | $22,300 | $184,600 |
| 2023 | $1,409 | $197,000 | $21,200 | $175,800 |
| 2022 | $1,505 | $188,000 | $20,000 | $168,000 |
| 2021 | $1,527 | $165,400 | $20,000 | $145,400 |
| 2020 | $1,753 | $183,000 | $20,000 | $163,000 |
| 2019 | $1,605 | $172,900 | $18,600 | $154,300 |
| 2018 | $1,606 | $169,200 | $18,600 | $150,600 |
| 2017 | $1,196 | $132,900 | $18,100 | $114,800 |
| 2016 | $1,122 | $127,600 | $18,100 | $109,500 |
| 2014 | $1,114 | $129,100 | $18,100 | $111,000 |
Source: Public Records
Map
Nearby Homes
- 4181 Baranga Dr
- 1042 W Main St
- 4538 Redcliff South Ln
- 5891 Farwell Ave
- 5875 Farwell Ave
- 2720 Bo St W
- 5716 Kensington Blvd
- 214 N Vine St
- 5733 Yorktown Rd
- 4011 Spirea Dr
- 2394 Eagle Ave
- 2198 Galleone Way
- 7683 Fairwood Blvd
- 303 Green St
- 329 Avon Ave
- 4114 Spirea Dr
- 3610 Homestead Place
- 5381 Buckingham Ln
- 5581 E County Road 350 S
- 4160 Lotus St
Your Personal Tour Guide
Ask me questions while you tour the home.