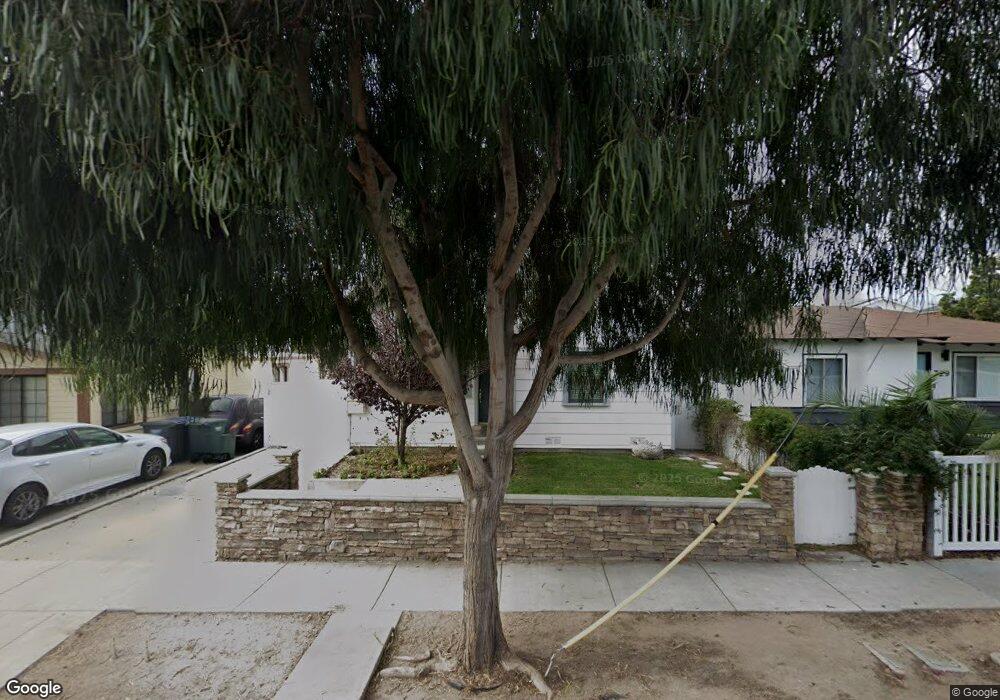
725 Virginia St El Segundo, CA 90245
Estimated Value: $1,248,000 - $1,609,477
3
Beds
2
Baths
1,176
Sq Ft
$1,271/Sq Ft
Est. Value
About This Home
This home is located at 725 Virginia St, El Segundo, CA 90245 and is currently estimated at $1,494,369, approximately $1,270 per square foot. 725 Virginia St is a home located in Los Angeles County with nearby schools including Richmond Street Elementary School, El Segundo Middle School, and El Segundo High School.
Ownership History
Date
Name
Owned For
Owner Type
Purchase Details
Closed on
Mar 24, 2004
Sold by
Clarke Wm R and Clarke Jacqueline A
Bought by
Clarke William R
Current Estimated Value
Purchase Details
Closed on
Jun 1, 2001
Sold by
Gillig Craig A and Berdugo Diana
Bought by
Clarke Wm R
Home Financials for this Owner
Home Financials are based on the most recent Mortgage that was taken out on this home.
Original Mortgage
$264,000
Interest Rate
7.09%
Purchase Details
Closed on
Nov 20, 1995
Sold by
Barnaby Robert E and Barnaby Karen M
Bought by
Gillig Craig A and Gillig Diana
Home Financials for this Owner
Home Financials are based on the most recent Mortgage that was taken out on this home.
Original Mortgage
$165,750
Interest Rate
6.87%
Create a Home Valuation Report for This Property
The Home Valuation Report is an in-depth analysis detailing your home's value as well as a comparison with similar homes in the area
Home Values in the Area
Average Home Value in this Area
Purchase History
| Date | Buyer | Sale Price | Title Company |
|---|---|---|---|
| Clarke William R | -- | -- | |
| Clarke Wm R | $330,000 | Fidelity Title | |
| Gillig Craig A | $195,000 | Title Land |
Source: Public Records
Mortgage History
| Date | Status | Borrower | Loan Amount |
|---|---|---|---|
| Previous Owner | Clarke Wm R | $264,000 | |
| Previous Owner | Gillig Craig A | $165,750 |
Source: Public Records
Tax History
| Year | Tax Paid | Tax Assessment Tax Assessment Total Assessment is a certain percentage of the fair market value that is determined by local assessors to be the total taxable value of land and additions on the property. | Land | Improvement |
|---|---|---|---|---|
| 2025 | $6,569 | $590,008 | $389,997 | $200,011 |
| 2024 | $6,569 | $578,440 | $382,350 | $196,090 |
| 2023 | $6,399 | $567,099 | $374,853 | $192,246 |
| 2022 | $6,467 | $555,980 | $367,503 | $188,477 |
| 2021 | $6,377 | $545,080 | $360,298 | $184,782 |
| 2019 | $6,160 | $528,914 | $349,612 | $179,302 |
| 2018 | $5,715 | $518,544 | $342,757 | $175,787 |
| 2016 | $5,546 | $498,411 | $329,449 | $168,962 |
| 2015 | $5,476 | $490,926 | $324,501 | $166,425 |
| 2014 | $5,362 | $481,310 | $318,145 | $163,165 |
Source: Public Records
Map
Nearby Homes
- 724 Loma Vista St
- 745 Main St
- 804 Hillcrest St
- 219 W Acacia Ave
- 408 Loma Vista St
- 955 Virginia St
- 412 Richmond St
- 716 W Oak Ave
- 121 E Walnut Ave
- 935 Main St Unit 202
- 935 Main St Unit 303
- 924 Main St
- 211 E Pine Ave
- 931 Hillcrest St
- 329 E Maple Ave
- 212 E Imperial Ave Unit E
- 770 W Imperial Ave Unit 60
- 426 E Imperial Ave
- 529 E Walnut Ave
- 228 Arena St Unit B
- 721 Virginia St
- 729 Virginia St
- 717 Virginia St
- 414 W Oak Ave
- 715 Virginia St
- 739 Virginia St
- 416 W Oak Ave
- 711 Virginia St
- 420 W Oak Ave
- 745 Virginia St
- 320 W Oak Ave
- 718 Virginia St
- 707 Virginia St
- 740 Virginia St
- 714 Virginia St
- 415 W Palm Ave
- 415 W Oak Ave
- 0 742-742 1 2 Virginia St Unit 2681199-4073864
- 424 W Oak Ave
- 742 Virginia St
Your Personal Tour Guide
Ask me questions while you tour the home.