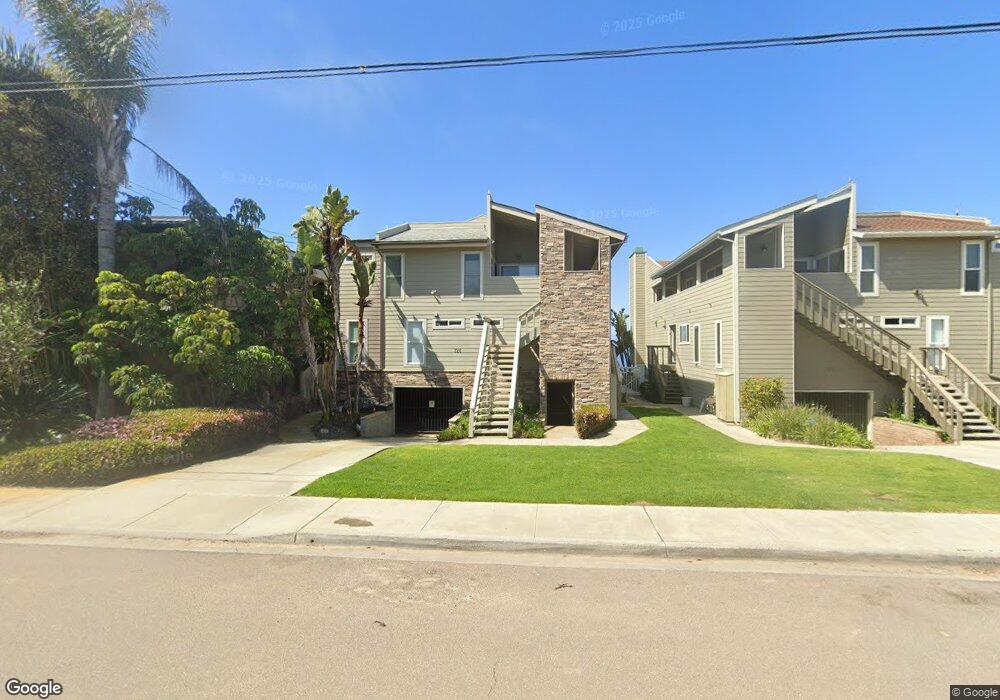
726 4th St Unit 3 Encinitas, CA 92024
Central Encinitas NeighborhoodEstimated Value: $2,929,000 - $3,539,000
4
Beds
3
Baths
2,055
Sq Ft
$1,549/Sq Ft
Est. Value
About This Home
This home is located at 726 4th St Unit 3, Encinitas, CA 92024 and is currently estimated at $3,183,055, approximately $1,548 per square foot. 726 4th St Unit 3 is a home located in San Diego County with nearby schools including Paul Ecke-Central Elementary, Diegueno Middle School, and La Costa Canyon High School.
Ownership History
Date
Name
Owned For
Owner Type
Purchase Details
Closed on
Mar 21, 2014
Sold by
Marshall Robert W
Bought by
Galloway John D and Liv Donna
Current Estimated Value
Purchase Details
Closed on
Aug 13, 2009
Sold by
Marshall Robert W
Bought by
Marshall Robert W
Purchase Details
Closed on
Oct 29, 1990
Bought by
Marshall Robert W
Purchase Details
Closed on
Nov 19, 1986
Create a Home Valuation Report for This Property
The Home Valuation Report is an in-depth analysis detailing your home's value as well as a comparison with similar homes in the area
Home Values in the Area
Average Home Value in this Area
Purchase History
| Date | Buyer | Sale Price | Title Company |
|---|---|---|---|
| Galloway John D | $2,375,000 | Chicago Title Company | |
| Marshall Robert W | -- | None Available | |
| Marshall Robert W | $585,000 | -- | |
| -- | $305,000 | -- |
Source: Public Records
Tax History
| Year | Tax Paid | Tax Assessment Tax Assessment Total Assessment is a certain percentage of the fair market value that is determined by local assessors to be the total taxable value of land and additions on the property. | Land | Improvement |
|---|---|---|---|---|
| 2025 | $30,553 | $2,918,377 | $2,451,721 | $466,656 |
| 2024 | $30,553 | $2,861,155 | $2,403,649 | $457,506 |
| 2023 | $30,055 | $2,805,055 | $2,356,519 | $448,536 |
| 2022 | $29,330 | $2,750,055 | $2,310,313 | $439,742 |
| 2021 | $29,010 | $2,696,133 | $2,265,013 | $431,120 |
| 2020 | $28,687 | $2,668,489 | $2,241,789 | $426,700 |
| 2019 | $28,098 | $2,616,167 | $2,197,833 | $418,334 |
| 2018 | $27,586 | $2,564,871 | $2,154,739 | $410,132 |
| 2017 | $27,127 | $2,514,581 | $2,112,490 | $402,091 |
| 2016 | $26,246 | $2,459,394 | $2,071,069 | $388,325 |
| 2015 | $26,032 | $2,422,452 | $2,039,960 | $382,492 |
| 2014 | $9,642 | $860,751 | $448,529 | $412,222 |
Source: Public Records
Map
Nearby Homes
- 806 4th St
- 922 Sealane Dr Unit B
- 538 4th St
- 937 3rd St
- 687 S Coast Highway 101 Unit 223
- 231 5th St
- 201 4th St Unit A & B
- 90 N Coast Highway 101 Unit 310
- 90 N Coast Highway 101
- 823 Stratford Dr
- 554 & 556 Stratford Dr
- 100 5th St
- 200 Neptune Ave Unit 2
- 1180 Devonshire Dr
- 215 N Vulcan Ave
- 233 Mangano Cir
- 103 Mangano Cir
- 407 Requeza St Unit E9
- 370 Carmel Creeper Place Unit 8
- 537 Sweet Pea Place
Your Personal Tour Guide
Ask me questions while you tour the home.