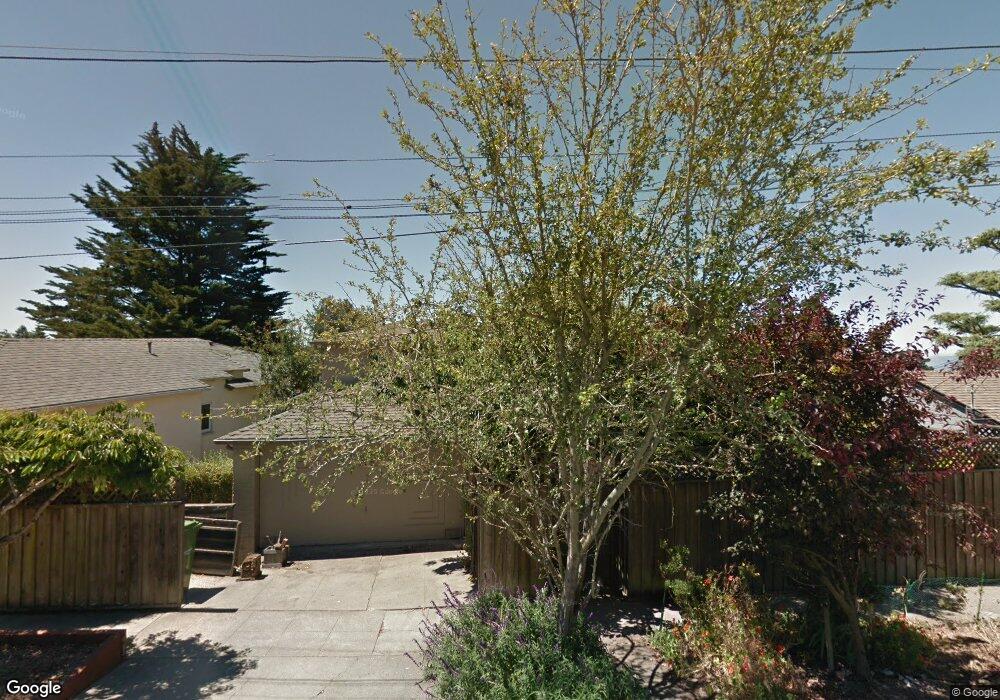
726 Grizzly Peak Blvd Berkeley, CA 94708
Berkeley Hills NeighborhoodEstimated Value: $1,522,000 - $2,040,464
4
Beds
4
Baths
2,890
Sq Ft
$612/Sq Ft
Est. Value
About This Home
This home is located at 726 Grizzly Peak Blvd, Berkeley, CA 94708 and is currently estimated at $1,767,366, approximately $611 per square foot. 726 Grizzly Peak Blvd is a home located in Alameda County with nearby schools including Cragmont Elementary School, Berkeley Arts Magnet at Whittier School, and Washington Elementary School.
Ownership History
Date
Name
Owned For
Owner Type
Purchase Details
Closed on
Sep 13, 2012
Sold by
Szpakowski Jean Luc and Polanski Eva Gloria
Bought by
Szpakowski Jean Luc and Polanski Eva Gloria
Current Estimated Value
Home Financials for this Owner
Home Financials are based on the most recent Mortgage that was taken out on this home.
Original Mortgage
$160,000
Outstanding Balance
$26,553
Interest Rate
3.55%
Mortgage Type
New Conventional
Estimated Equity
$1,740,813
Purchase Details
Closed on
Jun 21, 2006
Sold by
Szpakowski Jean Luc and Polanski Eva Gloria
Bought by
Szpakowski Jean Luc and Polanski Eva Gloria
Create a Home Valuation Report for This Property
The Home Valuation Report is an in-depth analysis detailing your home's value as well as a comparison with similar homes in the area
Home Values in the Area
Average Home Value in this Area
Purchase History
| Date | Buyer | Sale Price | Title Company |
|---|---|---|---|
| Szpakowski Jean Luc | -- | Old Republic Title Company | |
| Szpakowski Jean Luc | -- | Old Republic Title Company | |
| Szpakowski Jean Luc | -- | None Available |
Source: Public Records
Mortgage History
| Date | Status | Borrower | Loan Amount |
|---|---|---|---|
| Open | Szpakowski Jean Luc | $160,000 |
Source: Public Records
Tax History Compared to Growth
Tax History
| Year | Tax Paid | Tax Assessment Tax Assessment Total Assessment is a certain percentage of the fair market value that is determined by local assessors to be the total taxable value of land and additions on the property. | Land | Improvement |
|---|---|---|---|---|
| 2025 | $15,639 | $683,459 | $129,439 | $561,020 |
| 2024 | $15,639 | $669,923 | $126,901 | $550,022 |
| 2023 | $15,259 | $663,651 | $124,413 | $539,238 |
| 2022 | $14,854 | $643,638 | $121,973 | $528,665 |
| 2021 | $14,812 | $630,882 | $119,582 | $518,300 |
| 2020 | $13,652 | $631,343 | $118,356 | $512,987 |
| 2019 | $12,729 | $618,966 | $116,036 | $502,930 |
| 2018 | $12,437 | $606,831 | $113,761 | $493,070 |
| 2017 | $12,003 | $594,934 | $111,530 | $483,404 |
| 2016 | $11,369 | $583,271 | $109,344 | $473,927 |
| 2015 | $11,178 | $574,512 | $107,702 | $466,810 |
| 2014 | $10,953 | $563,261 | $105,593 | $457,668 |
Source: Public Records
Map
Nearby Homes
- 701 Grizzly Peak Blvd
- 680 Grizzly Peak Blvd
- 617 Grizzly Peak Blvd
- 543 Grizzly Peak Blvd
- 614 Cragmont Ave
- 541 Vistamont Ave
- 715 Santa Barbara Rd
- 815 Spruce St
- 45 Alta Rd
- 479 Kentucky Ave
- 74 Florida Ave
- 951 Cragmont Ave
- 962 Regal Rd
- 1998 San Antonio Ave
- 826 Indian Rock Ave
- 971 Santa Barbara Rd
- 411 Vassar Ave
- 605 Plateau Dr
- 1082 Cragmont Ave
- 720 Grizzly Peak Blvd
- 730 Grizzly Peak Blvd
- 733 Keeler Ave
- 737 Keeler Ave
- 708 Grizzly Peak Blvd
- 736 Grizzly Peak Blvd
- 741 Keeler Ave
- 744 Grizzly Peak Blvd
- 722 Keeler Ave
- 730 Keeler Ave
- 734 Keeler Ave
- 720 Keeler Ave
- 731 Grizzly Peak Blvd
- 725 Grizzly Peak Blvd
- 735 Grizzly Peak Blvd
- 745 Keeler Ave
- 752 Grizzly Peak Blvd
- 739 Grizzly Peak Blvd
- 719 Grizzly Peak Blvd
- 714 Keeler Ave