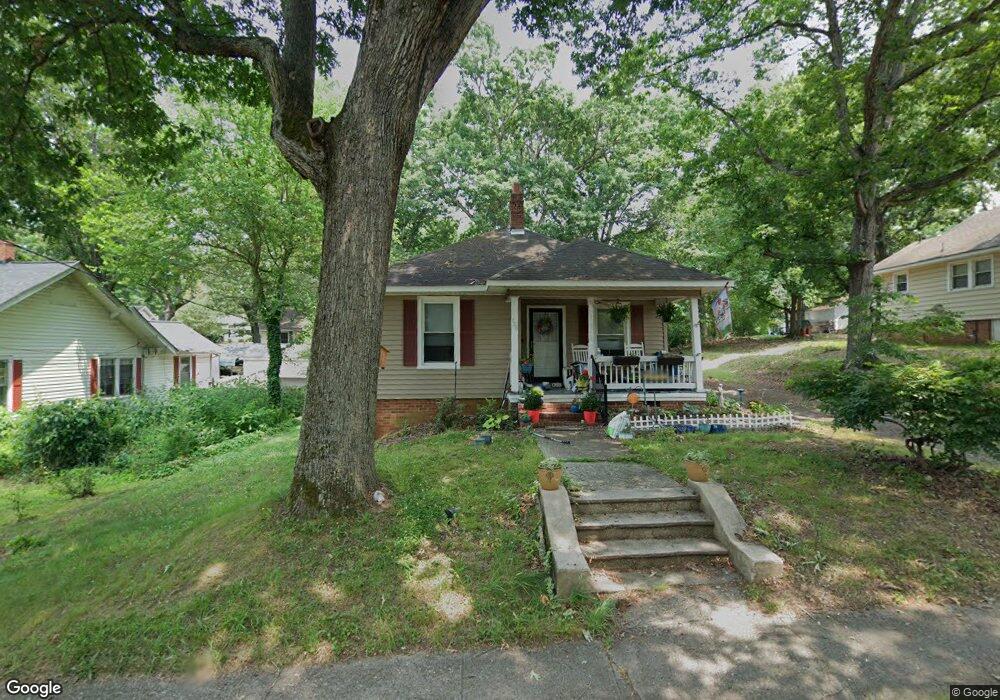
726 N 4th St Albemarle, NC 28001
Estimated Value: $138,000 - $169,000
2
Beds
1
Bath
984
Sq Ft
$153/Sq Ft
Est. Value
About This Home
This home is located at 726 N 4th St, Albemarle, NC 28001 and is currently estimated at $150,637, approximately $153 per square foot. 726 N 4th St is a home located in Stanly County with nearby schools including Central Elementary School, Albemarle Middle School, and Albemarle High School.
Ownership History
Date
Name
Owned For
Owner Type
Purchase Details
Closed on
Jul 22, 2016
Sold by
Seamon Patricia Lynn
Bought by
Thomasson Amber Brooke
Current Estimated Value
Purchase Details
Closed on
Jan 1, 2010
Bought by
Seamon Patricia Lynn
Purchase Details
Closed on
May 1, 2009
Sold by
Deese Terry R and Deese Lisa L
Bought by
Seamon Patricia Lynn
Home Financials for this Owner
Home Financials are based on the most recent Mortgage that was taken out on this home.
Original Mortgage
$69,500
Interest Rate
4.75%
Mortgage Type
Purchase Money Mortgage
Create a Home Valuation Report for This Property
The Home Valuation Report is an in-depth analysis detailing your home's value as well as a comparison with similar homes in the area
Purchase History
| Date | Buyer | Sale Price | Title Company |
|---|---|---|---|
| Thomasson Amber Brooke | $58,000 | Attorney | |
| Seamon Patricia Lynn | -- | -- | |
| Seamon Patricia Lynn | $69,000 | None Available |
Source: Public Records
Mortgage History
| Date | Status | Borrower | Loan Amount |
|---|---|---|---|
| Previous Owner | Seamon Patricia Lynn | $69,500 |
Source: Public Records
Tax History
| Year | Tax Paid | Tax Assessment Tax Assessment Total Assessment is a certain percentage of the fair market value that is determined by local assessors to be the total taxable value of land and additions on the property. | Land | Improvement |
|---|---|---|---|---|
| 2025 | $917 | $81,864 | $14,114 | $67,750 |
| 2024 | $745 | $61,036 | $7,817 | $53,219 |
| 2023 | $745 | $61,036 | $7,817 | $53,219 |
| 2022 | $745 | $61,036 | $7,817 | $53,219 |
| 2021 | $745 | $61,036 | $7,817 | $53,219 |
| 2020 | $754 | $58,137 | $6,948 | $51,189 |
| 2019 | $762 | $58,137 | $6,948 | $51,189 |
| 2018 | $762 | $58,137 | $6,948 | $51,189 |
| 2017 | $733 | $58,137 | $6,948 | $51,189 |
| 2016 | $502 | $39,811 | $6,948 | $32,863 |
| 2015 | $507 | $39,811 | $6,948 | $32,863 |
| 2014 | $536 | $39,811 | $6,948 | $32,863 |
Source: Public Records
Map
Nearby Homes
- 203 E Cannon Ave
- 507 N 5th St
- 436 E Oakwood Ave
- 701 E Oakwood Ave
- 620 N 9th St Unit 5/6
- 711 Yadkin St
- 274 N 4th St
- 719 Avondale Ave
- 219 Troy Alexander Dr
- 729 Montgomery Ave
- 346 N Depot St
- 1026 N 10th St
- 218 Wilson St Unit A&B
- 815 Sherwood Ave
- 10.02 Ash St
- 614 Smith St
- 526 Graham St
- 610 Watts St
- 1035 Pee Dee Ave
- 511 W Oakwood Ave
Your Personal Tour Guide
Ask me questions while you tour the home.